Beyond the Origin Story Deforestation Risk, Spatial Evidence, and EUDR Compliance in Vietnam’s Coffee Highlands

- by
- Mosaix
- July 16, 2026
The European Union Deforestation Regulation (EUDR) enacted through Regulation (EU) 2023/1115 shifts the compliance basis for agricultural commodities from document-based traceability to geolocation evidence and land history verification. Coffee, alongside cocoa, palm oil, soy, rubber, timber, and cattle, must now be demonstrably free of association with deforestation or forest degradation after the cut-off date of 31 December 2020.
This article presents the results of a Deforestation Risk Assessment (DRA) and forest-to-coffee conversion analysis for the period 2001–2024 across three major coffee-producing provinces in Vietnam’s Central Highlands: Dak Nong, Lam Dong, and Dak Lak. The assessment is not designed to render a legal verdict on Vietnamese coffee. It is a prioritisation tool — a framework that helps supply chain actors identify where evidence needs strengthening, where geolocation verification should be prioritised, and how compliance resources can be deployed proportionally.
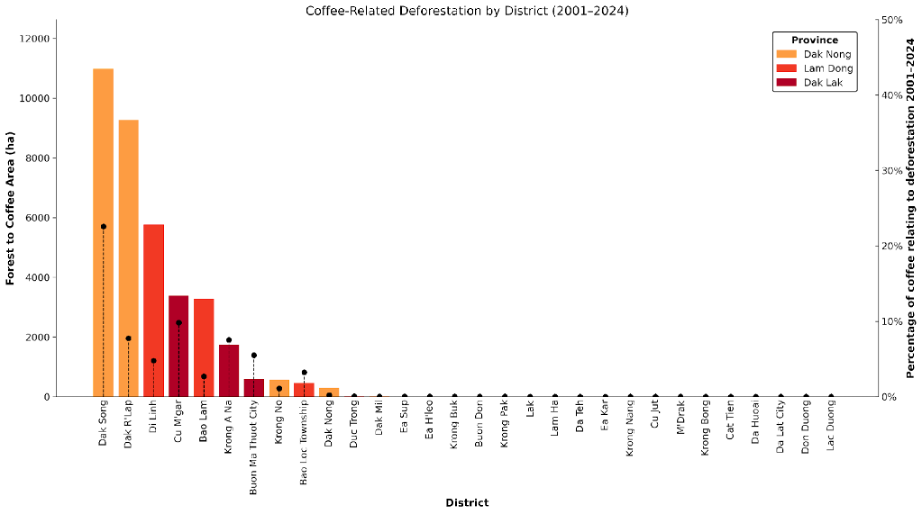
Results reveal sharp differences across provinces and districts. Dak Nong recorded the largest conversion: 21,121 ha or 4.97% of its year-2000 forest cover, concentrated in two dominant districts: Dak Song (10,982 ha, 22.58%) and Dak R’Lap (9,272 ha, 7.73%). Lam Dong recorded 9,518 ha with hotspots in Di Linh (5,769 ha) and Bao Lam (3,276 ha). Dak Lak recorded 5,731 ha with high local intensity in Cu M’gar (9.81%) and Krong A Na (7.53%).
This article builds a narrative from the assessment results: reading spatial conversion patterns as a risk-filtering basis, identifying priority districts, and translating analytical findings into operational implications for due diligence, evidence packs, and supplier engagement.
EUDR and the Shift to Spatial Evidence
For years, questions about coffee origin were answered by country name, purchasing region, or cooperative network. Under EUDR, that answer is no longer sufficient. Origin must be demonstrable as a production location tied to specific land, spatially verifiable, and unconnected to deforestation after the 31 December 2020 cut-off.
EUDR requires operators and traders to maintain evidence-backed due diligence statements. For plots larger than four hectares, the perimeter must be described by a polygon; for smaller plots, coordinate points may be used. This means compliance is moving toward precision sourcing: every batch must be traceable to a specific, verifiable production location.
Three evidentiary nodes of EUDR must operate simultaneously: geolocation as the entry gate, deforestation risk analysis as the interpretive layer, and the evidence pack as the auditable output. Without all three, traceability becomes merely a transaction record — not a guarantee of deforestation-free sourcing.
Coordinates only answer ‘where’. The next questions — whether the plot was previously forested, whether there was any tree cover loss after the cut-off, and whether the supply chain is free of blending — can only be answered through systematic spatial analysis.
Assessment Methodology
This assessment employs two complementary analytical layers: (1) a historical forest-to-coffee conversion analysis for the period 2001–2024, and (2) a predictive model-based Deforestation Risk Assessment. Both are grounded in coffee farm geolocation data and consistent forest cover datasets.
1. Forest-to-Coffee Conversion Analysis
The first layer reads what has historically occurred. Tree cover loss data from Hansen et al. (2013) was combined with coffee plantation layers to identify areas where forest was converted to coffee cultivation over a two-decade period. The analysis produces per-province and per-district metrics: absolute conversion area (ha), year-2000 forest cover as baseline, and percentage of forest replaced as a measure of relative intensity.
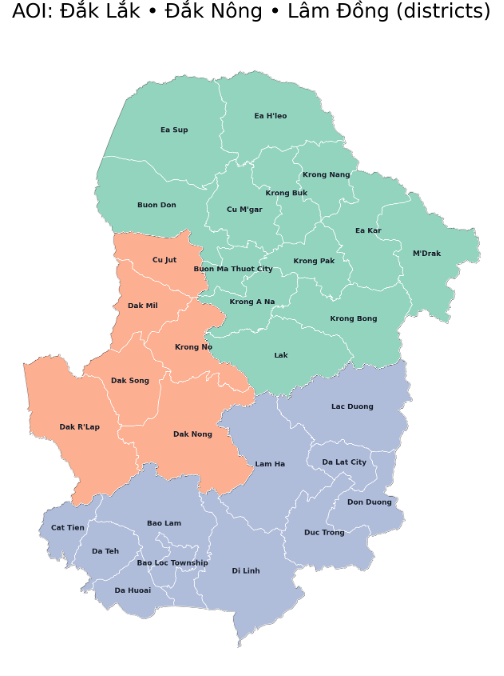
The Area of Interest (AOI) encompasses all districts across the three provinces: Dak Nong, Lam Dong, and Dak Lak. The primary unit of analysis is the administrative district, which provides sufficient resolution for operational prioritisation without losing provincial landscape context.
2. Deforestation Risk Assessment
The second layer constructs a forward-looking risk probability surface. The DRA workflow begins with geolocation data preparation: invalid polygons are corrected, very small artefacts are removed, and plots are clipped to the AOI. A working coffee mask is generated through rasterisation at 100-metre resolution.
The forest baseline is built from historical forest extent minus tree cover loss through the end of the analysis window. Recent loss is read within a five-year rolling window as the model’s target label. Spatial features used include: proximity to settlements (GHSL), permanent water bodies (JRC), coffee plantations (coffee mask), elevation and slope (SRTM), and administrative boundaries (FAO GAUL).
A Random Forest model is trained on balanced samples of recent loss and stable forest. The output is a relative risk probability surface aggregated to approximately 1 km grids and classified into five priority tiers: Low, Medium Low, Medium, Medium High, and High.
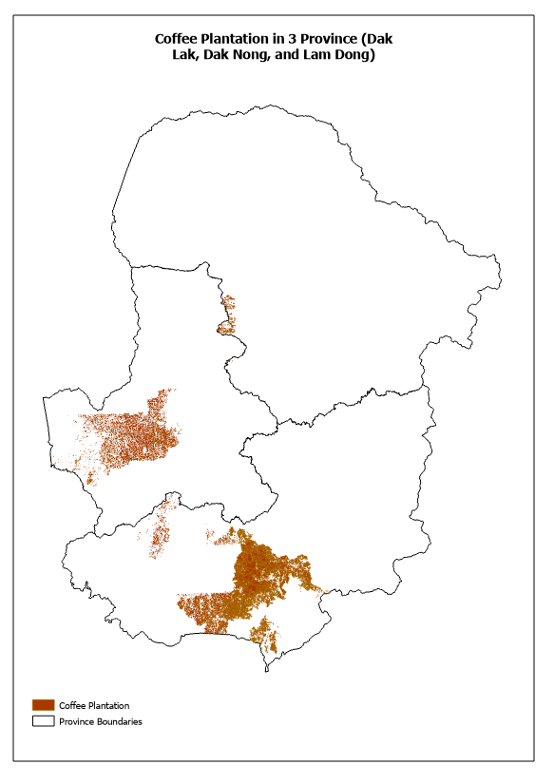
3. Assessment Results: Provincial Overview
At the provincial level, the assessment produces three headline figures that serve as the entry point for risk interpretation. Total indicated forest-to-coffee conversion across the entire AOI reached 36,371 ha — unevenly distributed across three provinces with markedly different profiles.
Table 1. Summary of assessment results by province. Source: Spatial forest-to-coffee conversion analysis, 2001–2024.
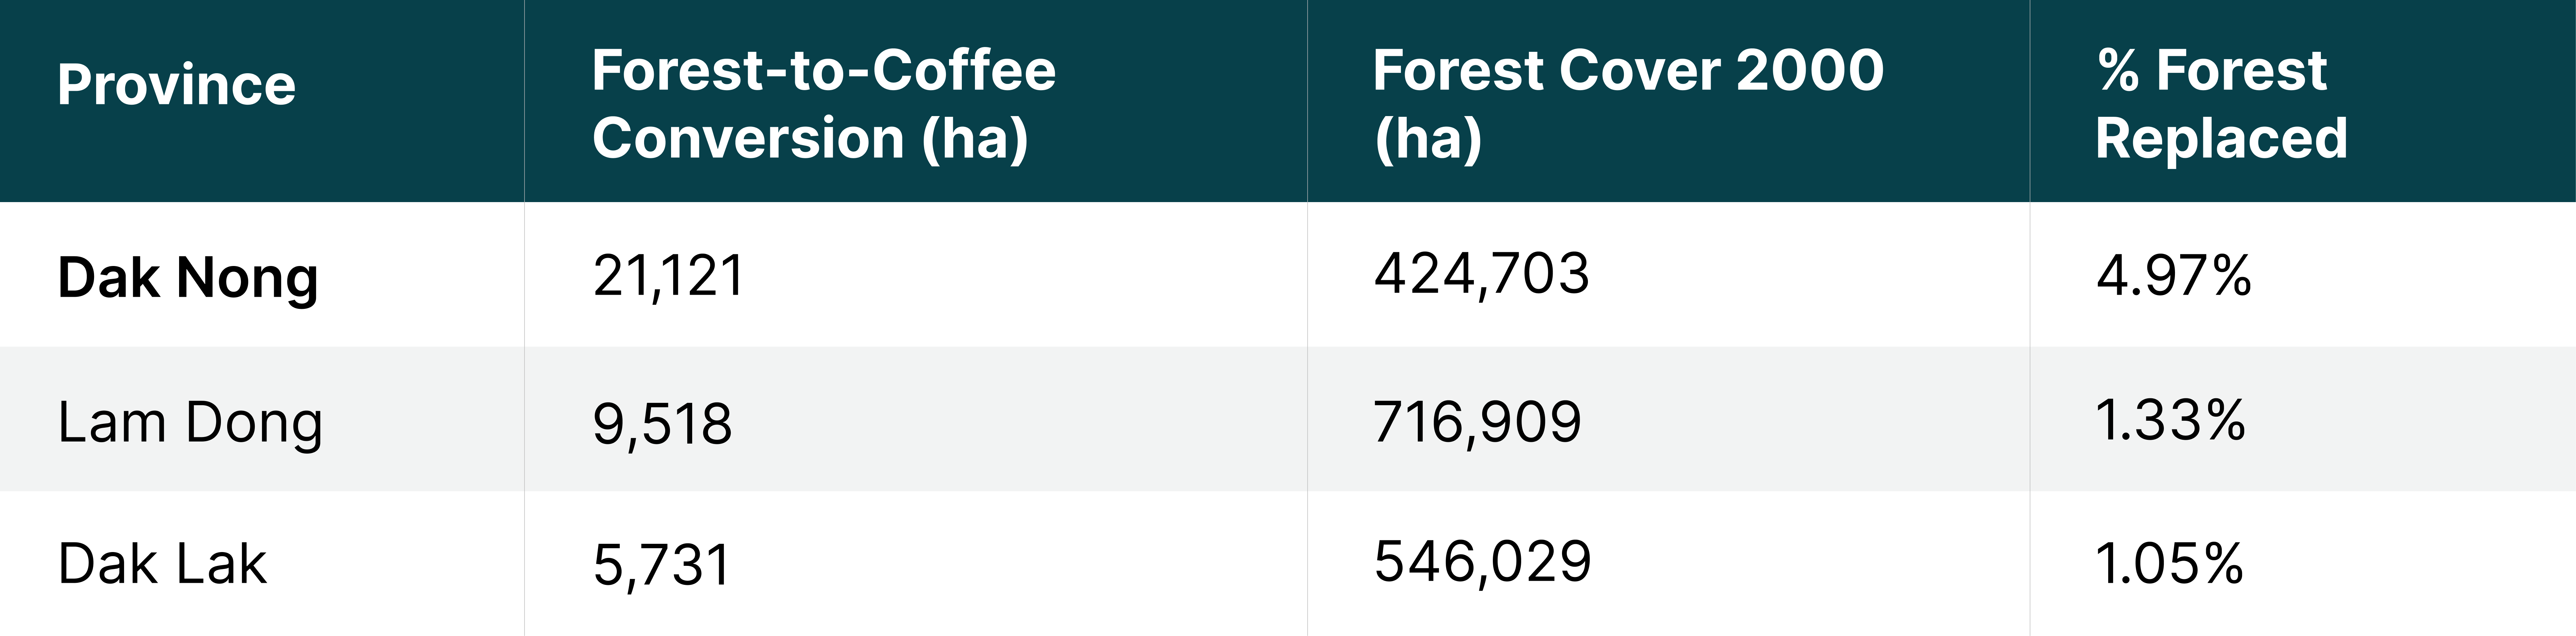
Dak Nong dominates with 21,121 ha — more than 58% of total AOI conversion. More significant than the absolute figure is its relative intensity: nearly 5% of all Dak Nong forest cover from the year 2000 has been converted to coffee plantations over two decades. This is an ecologically significant figure and directly relevant to due diligence frameworks.
Lam Dong recorded 9,518 ha at a provincial rate of 1.33%. This lower percentage requires contextualisation with district-level data — Lam Dong’s very large forest base (over 716,000 ha) dilutes the provincial intensity, even as several of its districts contain substantial conversion volumes.
Dak Lak recorded 5,731 ha or 1.05%. As Vietnam’s most iconic coffee province, the comparatively smaller total does not imply uniformly low risk. As shown in the district analysis, several areas of Dak Lak exhibit local intensities strong enough to trigger enhanced due diligence.
Assessment Results: District Analysis and Hotspots
District-level assessment is the most operationally actionable layer. This is where risk differences become sharp enough to support differentiated procurement decisions. Of the 30 districts within the AOI, the majority of conversion is concentrated in just six.
1. Conversion Distribution by District
Table 2. Ten districts with the highest indicated forest-to-coffee conversion
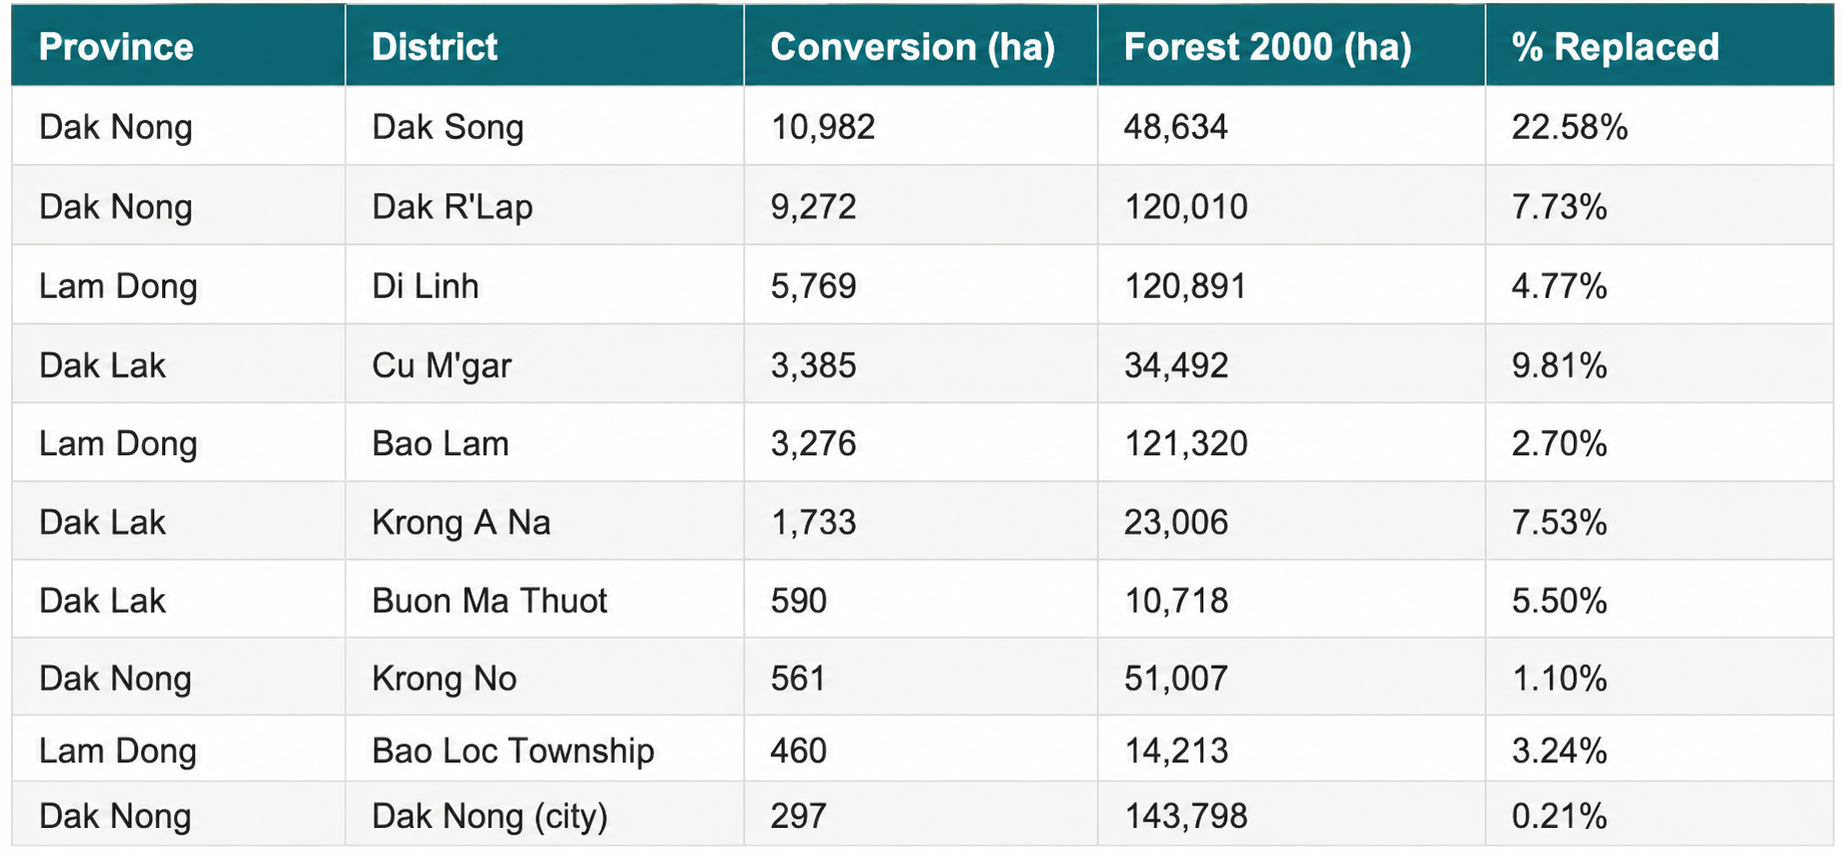
Two districts in Dak Nong — Dak Song and Dak R’Lap — dominate strikingly. Dak Song recorded 10,982 ha of conversion at 22.58% intensity: more than one-fifth of its local forest has changed function. This places Dak Song as the highest-risk district across the entire AOI in both absolute scale and relative intensity.
In Lam Dong, Di Linh recorded 5,769 ha — the third largest in the AOI — though its intensity is more moderate at 4.77%. Cu M’gar in Dak Lak shows 9.81% local intensity, significant because of its smaller forest base (34,492 ha).
2. Reading Two Risk Dimensions: Area vs. Intensity
This assessment employs two dimensions that do not always align: conversion area (ha) as a measure of absolute risk scale, and percentage of forest replaced as a measure of relative intensity against the local forest base. Both must be read together to avoid oversimplification.
Table 3. Risk profile matrix for the six primary hotspot districts.
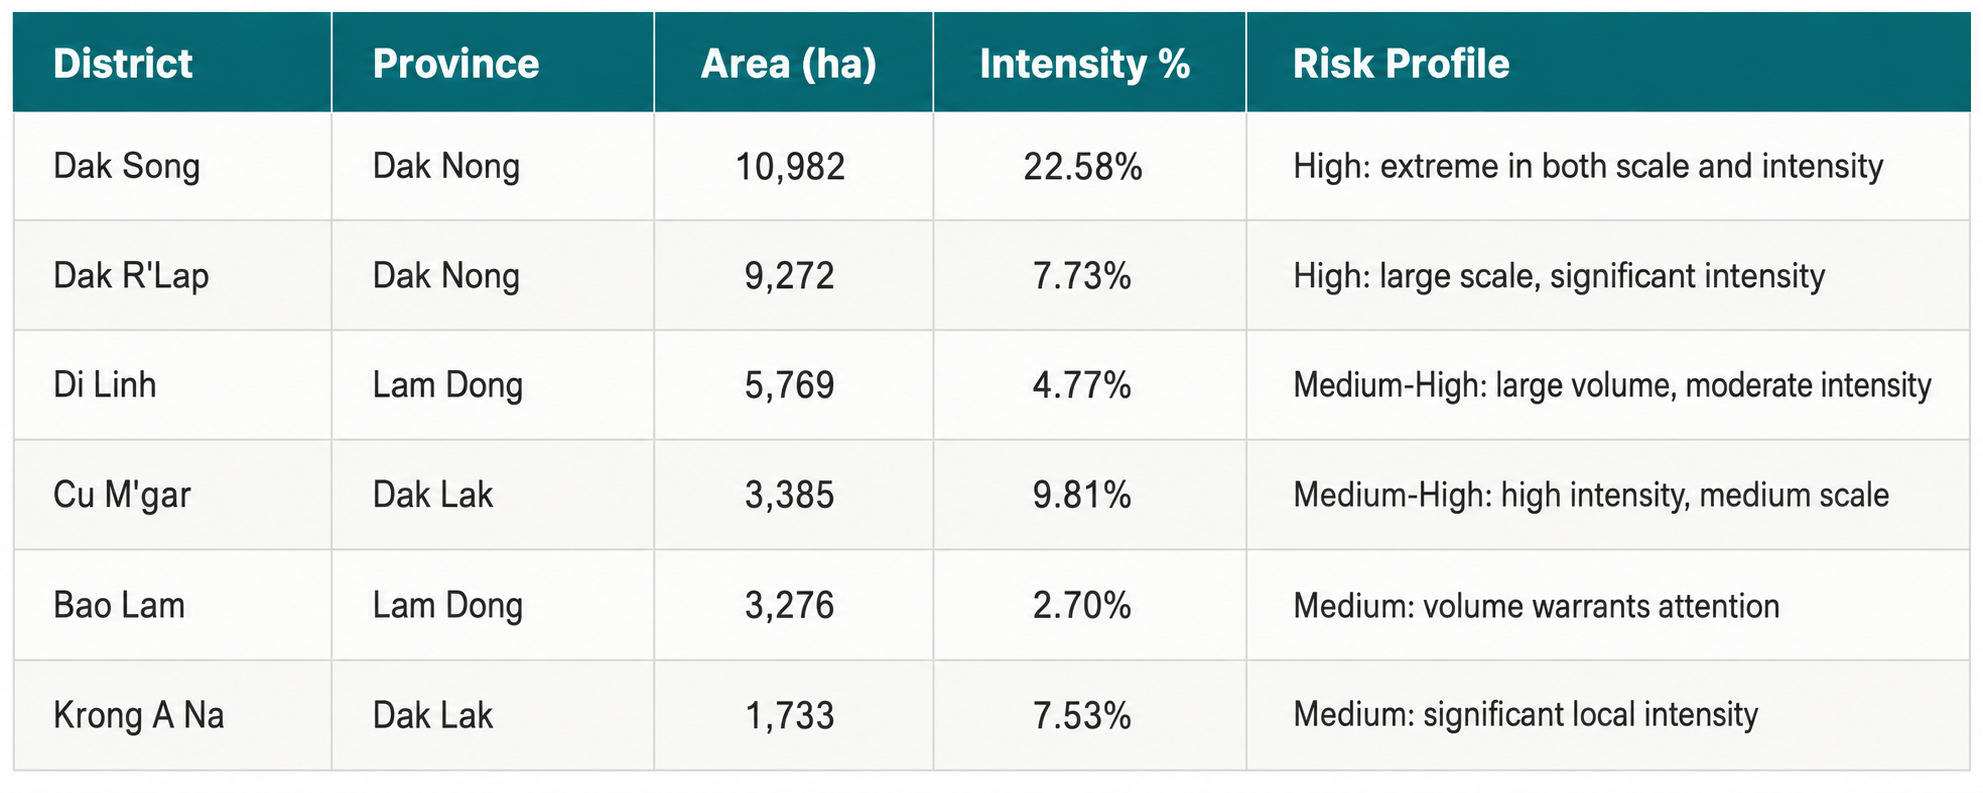
Dak Song is the only district that stands out in both dimensions: the highest area and the highest intensity. This makes it the unambiguous top-priority district, free from interpretive ambiguity. Dak R’Lap follows with a large scale despite more moderate intensity — which still places it firmly in the high-risk tier.
Cu M’gar is notable for its inverse pattern: smaller area than Di Linh, but local intensity (9.81%) is substantially higher. This means that within the district’s context, conversion pressure on local forest is deeply felt. A similar situation exists in Krong A Na (7.53%) — an intensity that cannot be overlooked despite a smaller absolute volume.
Risk Profiles of the Three Provinces
Once district figures are read, the assessment builds distinct risk profiles for each province. These profiles are not merely statistical summaries — they are the basis for proportional due diligence strategies.
Dak Nong is the risk epicentre of this assessment. With 21,121 ha of conversion (58% of total AOI) and a provincial intensity of 4.97%, Dak Nong already stands out at the aggregate level. But the most critical reading is at the sub-level: Dak Song and Dak R’Lap together account for more than 95% of all provincial conversion. Risk in Dak Nong is not evenly distributed — it is spatially concentrated. The due diligence implication is concrete: companies sourcing from Dak Nong must demonstrate that supply does not originate from these two districts — or, if it does, that the geolocation of specific plots does not intersect with historical conversion areas and that no tree cover loss occurred after the 2020 cut-off.
Lam Dong’s provincial percentage (1.33%) can easily be misread as a low-risk signal. The assessment shows that reading is misleading if it stops there. Lam Dong’s very large forest base (716,909 ha) dilutes the provincial percentage, but does not erase the fact that Di Linh (5,769 ha) and Bao Lam (3,276 ha) have recorded real conversion volumes. Di Linh is Vietnam’s most important arabica coffee production centre. Procurement volumes from this district tend to be large in many companies’ portfolios. The combination of substantial historical conversion and Di Linh’s strategic role in premium coffee supply chains makes it a verification priority that cannot be ignored on the strength of a low provincial percentage alone.
Dak Lak is Vietnam’s most famous coffee province — and that reputation can itself become a hidden risk under EUDR. A region’s reputation does not substitute for plot-level proof. The assessment shows that while Dak Lak’s total conversion is smaller (5,731 ha, 1.05%), Cu M’gar (9.81%) and Krong A Na (7.53%) have local intensities that are sufficiently strong. Buon Ma Thuot City, as the largest coffee collection hub, recorded 590 ha of conversion at 5.50% intensity — a figure relevant because of the very large supply volumes passing through and the higher potential for origin blending across districts.
From Assessment to Action: The Due Diligence Framework
The assessment produces signals — not final decisions. Its value lies in its capacity to transform complex data into concrete, proportional action priorities.
1. The Agriplot Due Diligence System
The Agriplot Due Diligence System is a purpose-built, web-based platform designed to meet the EUDR’s plot-level compliance demands. The platform integrates supply chain data, multi-temporal satellite imagery, and AI-powered geospatial analytics to generate the plot-level visibility required for due diligence. In the context of Vietnamese coffee, Agriplot functions as the bridge between farm geolocation data in the field and the forest loss database — enabling users to verify whether a given plot has a history of deforestation after the 31 December 2020 cut-off.
Research by Murti et al. (2026) demonstrates that dashboard-based systems of this kind — linking data from the product level down to the individual plot — represent critical infrastructure for meeting EUDR requirements while also advancing regenerative agricultural practices more broadly.
An audit-ready evidence pack for coffee under EUDR requires four interconnected layers:
Table 4. Four evidence-pack layers for EUDR coffee due diligence.
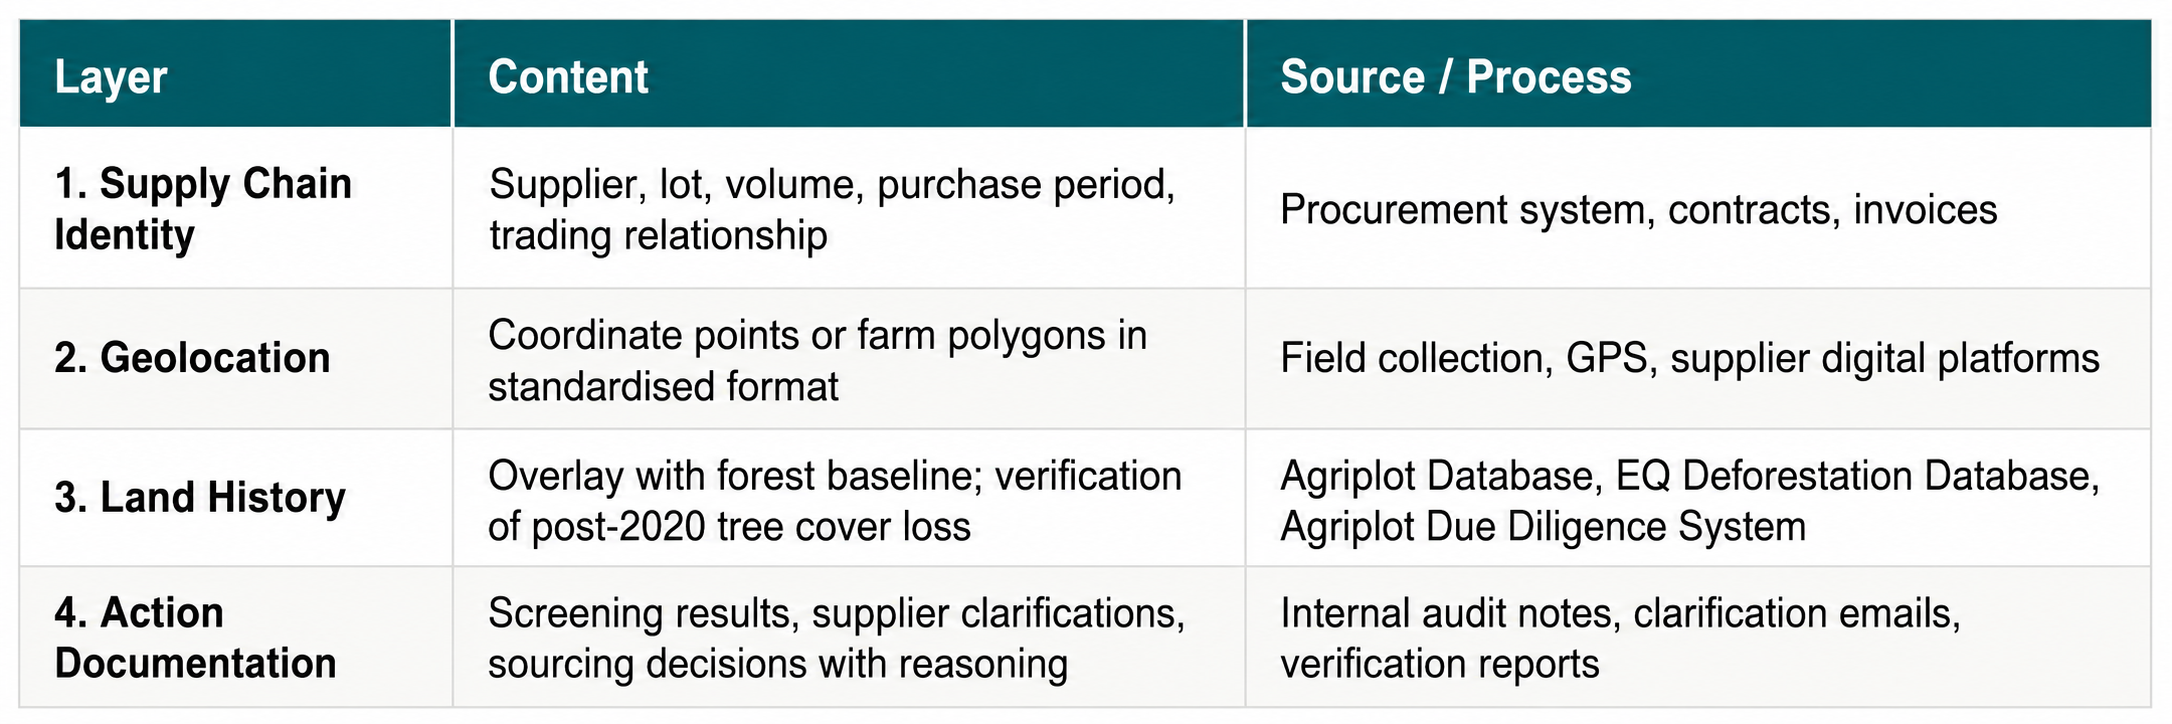
This assessment contributes most directly to the third layer: signalling where land history needs to be examined more intensively. It does not replace plot verification, but determines where that verification should be prioritised.
2. Legal Production: Land Legality as an Evidence Requirement
EUDR is often discussed as a deforestation-free regulation, but the compliance test is broader. The commodity also has to be produced in accordance with the relevant legislation of the country of production. For coffee, this makes legality a separate evidence question: a plot may pass a forest-loss overlay, while still requiring confirmation that production is legally grounded under applicable land-use, tenure, environmental, labour, tax, or other national requirements.
In practice, legality evidence should be connected to the same origin record used for geolocation and land-history screening. A supplier file should therefore link the farm or farmer group to a declared plot, the available farmer or cooperative registration record, land-use or supplier declaration, and any clarification needed for disputed or incomplete cases. The purpose is not to overburden smallholders with paperwork, but to make the evidence pack internally consistent and auditable.
3. Inside the Agriplot Dashboard
The Agriplot dashboard is a visual interface designed to translate complex geospatial data into operationally actionable information. The main view displays several functionally integrated components:
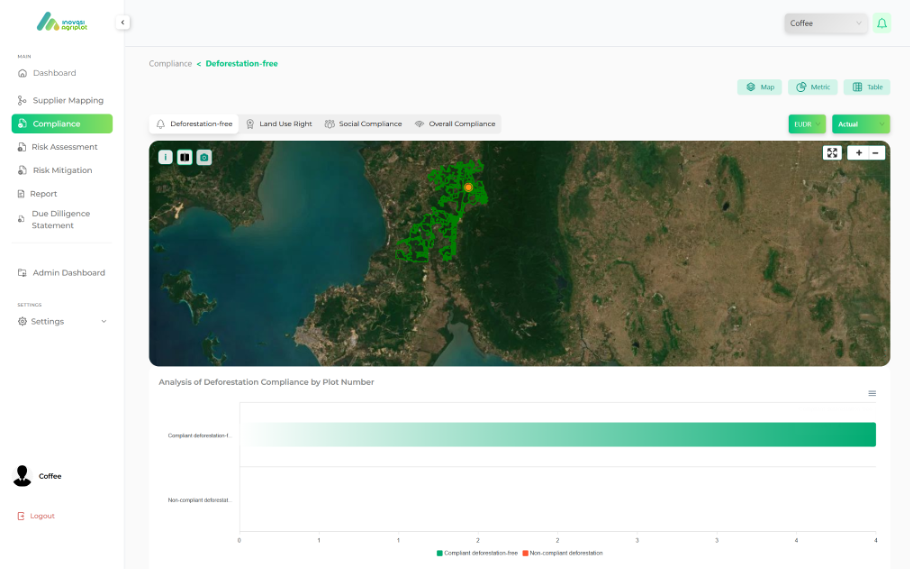
In the Vietnamese coffee context, the integration of district-level results from this assessment with a platform like Agriplot creates a two-layer system that reinforces itself: spatial analysis at the district level provides a macro risk map for procurement prioritisation, while Agriplot supplies the micro verification infrastructure to demonstrate that specific plots do not intersect with historical conversion areas and are free of tree cover loss after the 2020 cut-off.
Coffee Supply Chain and Export Flow Context
The spatial assessment becomes easier to use when it is read alongside the way coffee moves commercially. In practice, origin is not created by one export record. It is built through a chain of farms, buying points, collectors, cooperatives, processors, exporters, and buyers. This is why shipment-level data is useful for understanding market exposure, but cannot replace farm-level traceability.
For EUDR, the operational question is therefore twofold. First, can a commercial lot be traced back to the farmers and land parcels that produced it? Second, can the same origin record support deforestation screening, legality checks, and supplier follow-up when risk is detected?
1. From Farmers to Exporters
A typical coffee flow begins with farmers producing cherries or dried beans. Collectors and local buyers then consolidate small volumes from many farms. Cooperatives, traders, or processors may sort, dry, grade, store, and prepare coffee for a specification. Exporters arrange the formal shipment, while overseas buyers, roasters, or operators receive the product and make regulatory decisions.
Each hand-off changes the evidence problem. At the farm level, the core questions are plot identity, land history, and legal production. At collection level, the question becomes whether coffee from different farms or villages has been mixed before documentation is complete. At exporter level, the question becomes whether the shipment can be reconciled back to the intake lots and farmer lists behind it.
Industry examples show why this distinction matters. The Global Coffee Platform describes Simexco Daklak as a leading Vietnamese coffee exporter with a farm-gate purchasing network, training and quality-control activities in growing areas, and annual green-coffee purchasing and export capacity of more than 100,000 tonnes (Global Coffee Platform, 2023). Vietnam Agriculture Newspaper also reports that enterprises and cooperatives in Lam Dong and Dak Lak are building raw material areas through farmer linkages, including company relationships with thousands of households and cooperative sales to exporters such as Simexco Daklak and Dakman (Vietnam Agriculture Newspaper, 2023).
The implication is direct: an exporter name is useful, but it is not enough. Compliance evidence has to follow the coffee upstream, especially where a shipment is assembled from many small farms, multiple collectors, or several villages within one commercial lot.
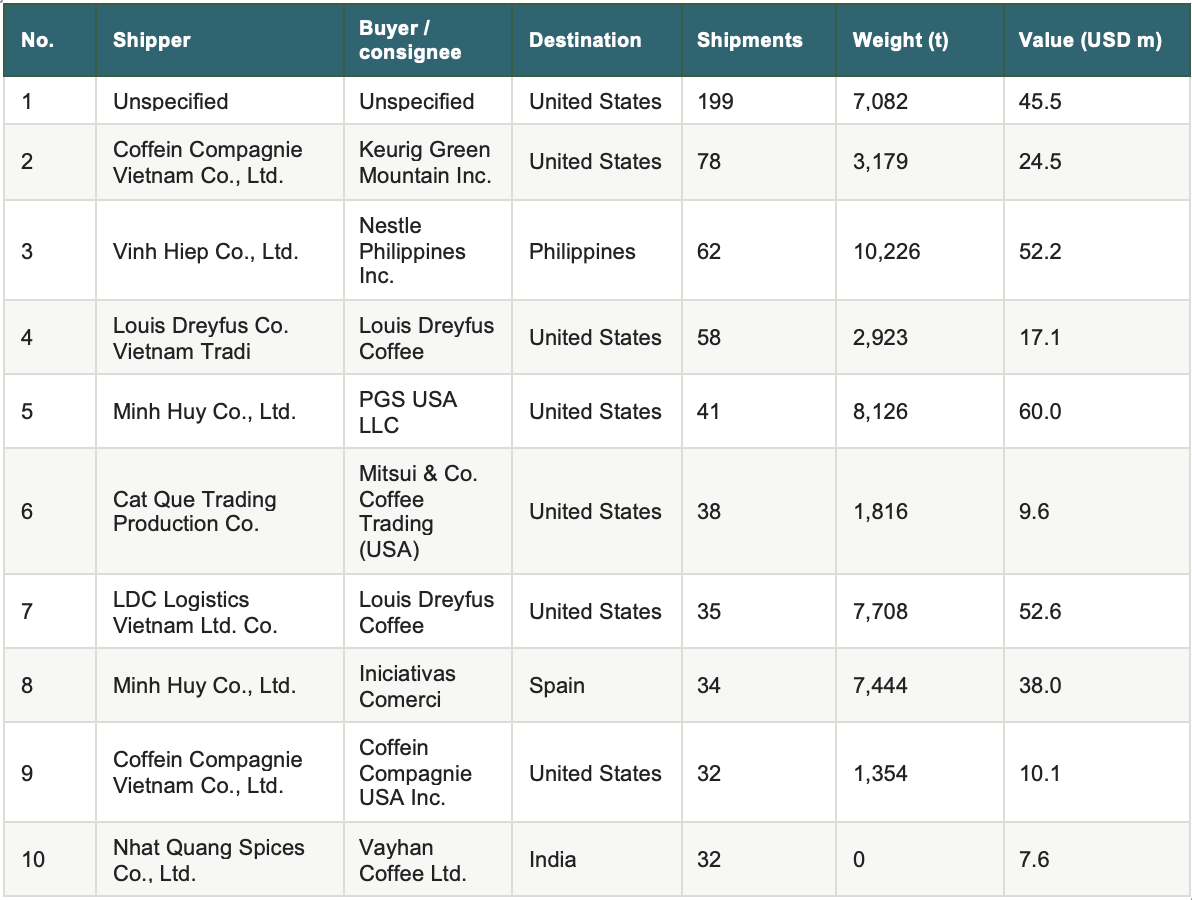
2. Export Flow as a Trade Lens
The Sankey diagram below complements the spatial assessment by showing the main commercial routes in the filtered Vietnam-origin coffee export dataset. It helps identify major shipper-buyer relationships and destination markets. It should not be read as proof of plot-level compliance, because trade-flow data does not show whether each shipment is linked to farm geolocation, segregated lots, or land-history checks.
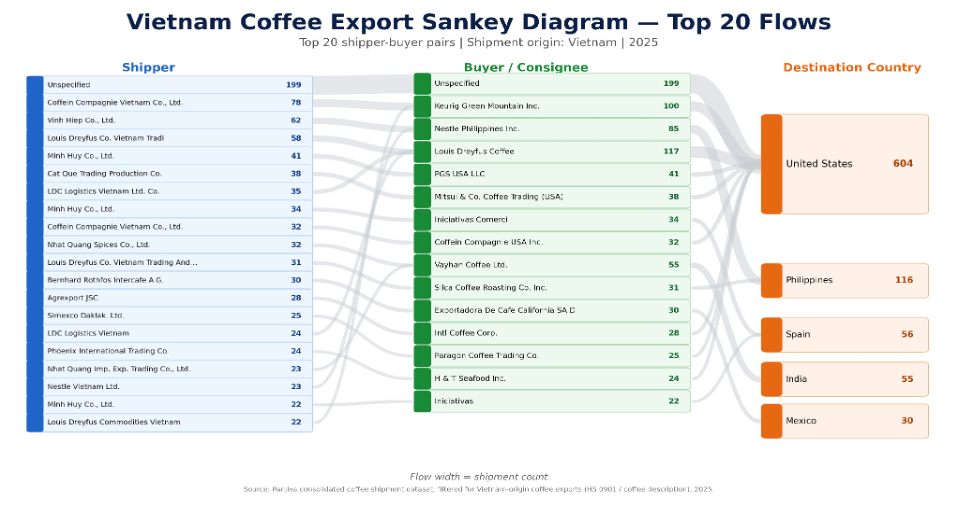
Table 5. Main destination markets for Vietnam-origin coffee exports in the filtered dataset.
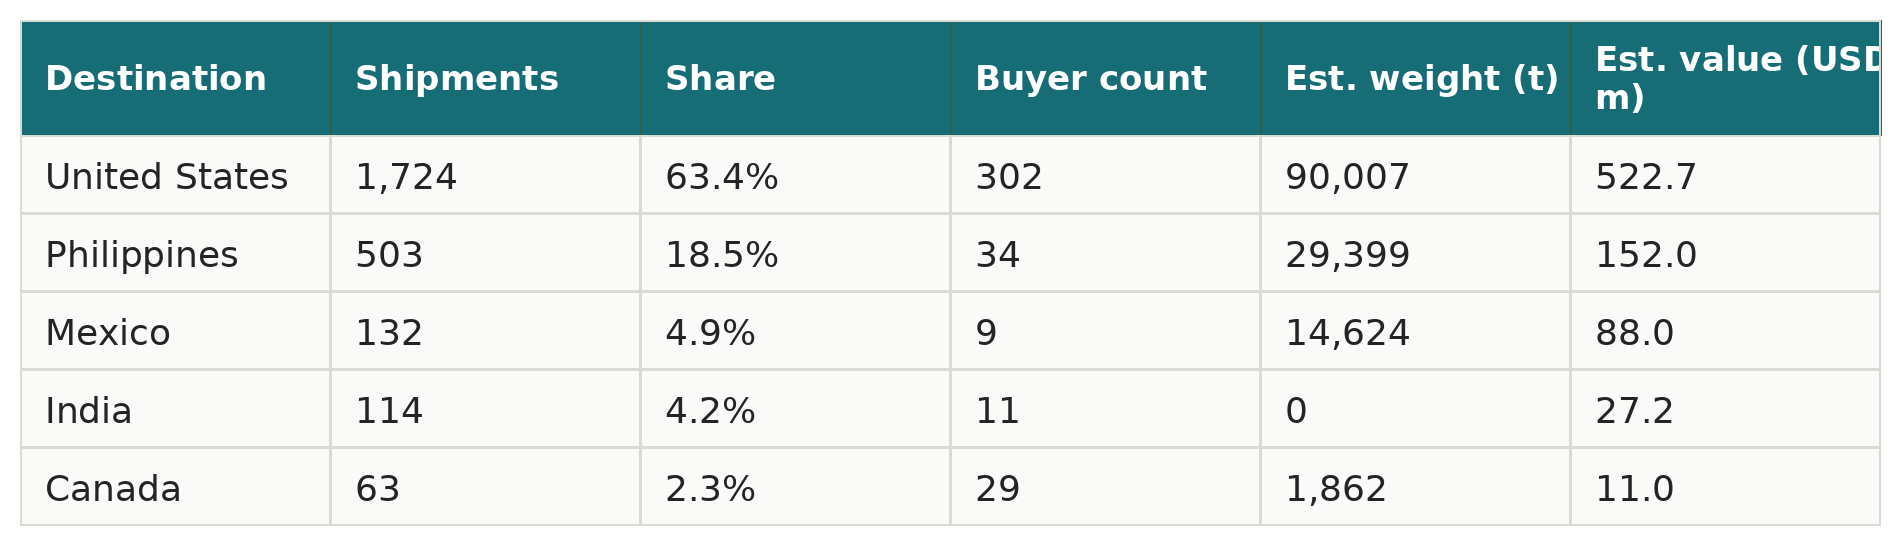
Table 6. Selected top shipper-buyer flows used to support the Sankey interpretation.
3. Blending Risk and Lot-Level Traceability
The most material traceability risk in coffee is often not the exporter name itself. It is the possibility that coffee from many farms, villages, or districts is combined into one commercial lot before the evidence is complete. A shipment can have a clear shipper and consignee while still containing coffee from multiple production areas with different land histories.
Under EUDR, that matters because a deforestation-free conclusion must be supported by a traceable link between the shipment, the commercial lot, the supplier intake records, and the relevant farm geolocations. If the lot cannot be reconciled back to its contributing farms, then the shipment has an evidence gap even if the exporter is known and the destination market is clear.
For hotspot districts identified in this assessment, companies should test whether lots were segregated, whether purchase records can be reconciled with farmer lists, whether weight balances are plausible, and whether the declared origin matches the physical flow of coffee. Where traceability is incomplete, the gap should be documented as a data-improvement issue and handled through a time-bound corrective action plan, not treated as affirmative evidence of compliance.
Supplier Engagement and Risk Response
The purpose of the assessment is to guide better engagement, not to label whole areas as unacceptable. A high-risk district is a signal that verification should be deeper and documentation should be stronger. It is not, by itself, evidence that every supplier or farmer in that district is non-compliant.
This distinction is important for smallholder-inclusive sourcing. If companies react to risk maps by excluding entire sourcing areas, compliant farmers inside those areas may be unfairly removed from the supply chain. A more proportionate response is to use risk tiers to prioritise data correction, supplier clarification, and targeted verification.
1. High-Risk Areas Are Not Automatic Non-Compliance
Suppliers in higher-risk areas should be asked for stronger geolocation evidence, clearer lot documentation, and written clarification where a plot intersects with historical conversion or recent tree-cover loss. Where the issue is data quality, the response should focus on correction and verification. Where the issue is confirmed post-cut-off deforestation or an unresolved legality concern, the sourcing decision should be escalated and documented.
This approach keeps the burden proportionate. It also creates a practical pathway for improvement: first map the supplier base, then reconcile lots, then test land history and legality, and finally record the sourcing decision with the reasoning behind it.
2. Control Points for Action
Table 7. Supply-chain control points and due diligence focus for EUDR coffee.
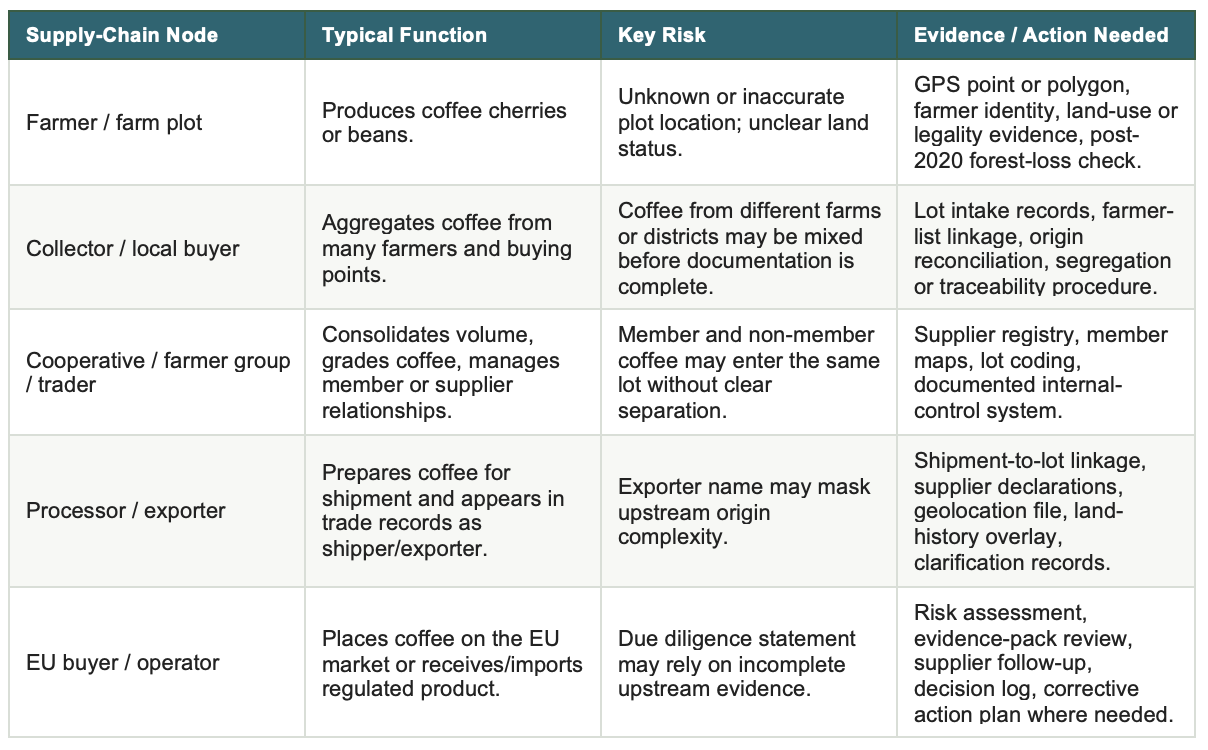
The control points show why EUDR evidence should be designed as a chain, not as a single document. The same shipment may require farmer geolocation, lot reconciliation, land-history overlay, legality review, and a supplier engagement record before it can support a defensible due diligence conclusion.
Operational Implications for Value Chain Actors
Each actor in the value chain reads the assessment results from a different position. This section translates the assessment findings into role-specific implications.
1. Operators and Exporters
Operators are closest to upstream data. The primary challenge: geolocation quality from farmers — imprecise coordinates, overlapping polygons, or unclear farm boundaries. Assessment-based recommendations:
- Prioritise geolocation data improvement programmes in Dak Song, Dak R’Lap, Di Linh, and Cu M’gar first.
- Ensure supply segregation systems distinguish lots with verified geolocation from those without.
- Build automated overlay processes between supplier coordinates and historical conversion layers as a standard part of lot intake.
2. Traders
Traders require sharp risk segmentation because they manage large volumes from many sources. Assessment implications:
- Group suppliers by origin district and risk tier — not merely by country or province.
- Apply differentiated evidence requirements: suppliers from High-risk districts require polygons and land history; Low-risk districts can be handled with coordinate points and standard documentation.
- Integrate district summaries from this assessment into supplier scorecard systems.
3. Roasters and Brands
Roasters and brands bear the weight of expectations from consumers, regulators, and auditors. Assessment implications:
- Deforestation-free claims must be systematically explainable: where the coffee originates, how its land history was checked, and how sourcing decisions were documented.
- This assessment can serve as the basis for a credible sustainability narrative — demonstrating that risk is read spatially, not merely claimed in general terms.
- For public communication, use precise language: ‘We conduct risk-based due diligence using spatial analysis’, rather than absolute claims that are difficult to substantiate.
Conclusion
The forest-to-coffee conversion assessment for Dak Nong, Lam Dong, and Dak Lak produces a clear picture: coffee-related deforestation risk in Vietnam’s Central Highlands is not uniformly distributed. It is concentrated in specific districts — particularly Dak Song and Dak R’Lap in Dak Nong, Di Linh in Lam Dong, and Cu M’gar in Dak Lak.
The total 36,371 ha of forest-to-coffee conversion identified over the period 2001–2024 should not be read as an indictment of the Vietnamese coffee industry. It is a risk map that helps supply chain actors ask more precise questions: from which district does this coffee originate, what is its land history, and is the available evidence sufficient to meet EUDR due diligence standards.
The primary value of this assessment lies not in the map itself — but in the way the map compels more precise questions, drives more structured documentation, and directs verification resources to locations that need them most. Over the long term, companies capable of reading risk spatially will be better positioned to substantiate deforestation-free claims — and better able to sustain equitable, responsible sourcing.
EUDR compliance for coffee cannot be resolved through a compelling origin narrative. It requires maps, data, and systems that connect the two into auditable evidence.
References
- European Parliament and Council of the European Union. (2023). Regulation (EU) 2023/1115 on the making available on the Union market and the export from the Union of certain commodities and products associated with deforestation and forest degradation. Official Journal of the European Union.
- European Commission. (2026). Regulation on Deforestation-free Products. Directorate-General for Environment. Retrieved May 2026 from https://environment.ec.europa.eu/topics/forests/deforestation/regulation-deforestation-free-products_en
- European Commission. (2026). Frequently Asked Questions on the EU Deforestation Regulation, 5th iteration. Directorate-General for Environment.
- Coffee Deforestation Risk Assessment (DRA), Dak Lak Province, Viet Nam. Technical report on methods, district analytics, and spatial deliverables (internal analytical document, 2025).
- Spatial Forest-to-Coffee Conversion Analysis, Dak Nong, Lam Dong, and Dak Lak, Vietnam, 2001–2024. Provincial summaries, district summaries, AOI maps, indicative rasters (internal analytical document, 2025).
- Hansen, M. C., Potapov, P. V., Moore, R., Hancher, M., Turubanova, S. A., Tyukavina, A., Thau, D., Stehman, S. V., Goetz, S. J., Loveland, T. R., Kommareddy, A., Egorov, A., Chini, L., Justice, C. O., & Townshend, J. R. G. (2013). High-resolution global maps of 21st-century forest cover change. Science, 342(6160), 850–853. https://doi.org/10.1126/science.1244693
- Joint Research Centre (JRC), European Commission. (2023). JRC Global Surface Water Explorer and Forest Cover Monitoring datasets.
- Global Human Settlement Layer (GHSL). (2023). GHS-BUILT and GHS-POP datasets. European Commission, Joint Research Centre. https://ghsl.jrc.ec.europa.eu
- NASA Shuttle Radar Topography Mission (SRTM). (2000). SRTM 1 Arc-Second Global Elevation Data. U.S. Geological Survey. https://doi.org/10.5066/F7PR7TFT
- Food and Agriculture Organization of the United Nations (FAO). (2015). FAO GAUL: Global Administrative Unit Layers. UN FAO.
- FAO / Forest Data Partnership. Coffee Probability Layer and Regional Land Cover datasets (accessed 2024–2025).
- General Statistics Office of Vietnam (GSO). (2023). Agricultural Statistics: Coffee Production Area and Output by Province.
- Vietnam Ministry of Agriculture and Rural Development (MARD). (2023). Annual Forest Inventory and Reporting, Central Highlands Provinces.
- Breiman, L. (2001). Random Forests. Machine Learning, 45(1), 5–32. https://doi.org/10.1023/A:1010933404324
- Murti, S., Rahmawati, D. C., Pratama, M., Yazid, H., Ishak, Pamungkas, C., & Rafina, I. (2026). From product to plot: developing a visual dashboard to support beyond deforestation-free to regenerative supply chains. IOP Conference Series: Earth and Environmental Science, 1622, 012016. https://doi.org/10.1088/1755-1315/1622/1/012016
- Global Coffee Platform. (2023). Meeting Members: Over a cup of coffee with SIMEXCO DAKLAK. https://www.globalcoffeeplatform.org/latest/2023/meeting-members-over-a-cup-of-coffee-with-simexco-dak-lak/
- Vietnam Agriculture Newspaper. (2023). Robusta Coffee: Expanding raw material areas to meet orders. https://van.nongnghiepmoitruong.vn/expanding-raw-material-areas-to-meet-orders-d357765.html
- Panjiva. (2025). Panjiva Consolidated Export Coffee 0901 shipment dataset. Shipment-level dataset used for supplementary trade-flow analysis.
Prefer to read it offline or share it with your team?
Download the PDF version of the full article below.
 MosaiX Article