Ecuador’s cocoa sector has the geography, market reputation and increasingly sophisticated supply chains to remain a major supplier to Europe. But a spatial assessment by MosaiX shows that the transition toward EUDR-ready cocoa will depend on something more fundamental: knowing exactly where cocoa comes from, what happened on that land before 2021, and whether the evidence can withstand scrutiny.
Ecuador is one of the world’s important cocoa origins, with production landscapes stretching across the humid lowlands of the Pacific coast and into parts of the country’s interior. A recent geospatial assessment identified roughly 3 million hectares of potential cocoa-planted area, equivalent to about 11.9% of Ecuador’s territory, with major concentrations in Manabí, Esmeraldas, Los Ríos, Morona Santiago, Santo Domingo de los Tsáchilas and Guayas.
That scale tells only part of the story.
As the European Union Deforestation Regulation reshapes expectations around cocoa sourcing, the central question is shifting from where cocoa is grown to whether every shipment can be connected to land whose history, legality and boundaries can be demonstrated.
The assessment suggests Ecuador has considerable potential to make that transition. But it also reveals several gaps that could become far more important than production volume itself.
A land-documentation gap hiding beneath the cocoa map
One of the most striking findings concerns land status.
According to the spatial comparison used in the assessment, around 2.8 million hectares, or approximately 92% of the mapped potential cocoa area, fall outside the registered land layer used in the analysis, while roughly 244,000 hectares, or 8%, appear as registered.
That figure needs to be interpreted carefully.
The report itself notes that the cocoa dataset represents potential planting areas as well as areas identified as cocoa, meaning it can overestimate actual planted hectares. It also warns that cadastral information can be incomplete in rural areas. The 92% figure should therefore not be read as proof that 92% of Ecuadorian cocoa farms are legally invalid or without legitimate tenure. It is better understood as a measure of the documentation and spatial-data gap that would need to be resolved during due diligence.
That distinction matters.
For EUDR implementation, a farm does not become compliant simply because its coordinates are known. Buyers need sufficiently reliable evidence connecting a commodity to its production plot, alongside evidence supporting deforestation-free status and compliance with applicable laws.
In other words, mapping is the beginning of due diligence, not the end of it.
The deforestation signal is relatively small—but it cannot be ignored
When the mapped cocoa plots were overlaid with post-2020 forest-loss information, the analysis identified 185 plots out of 212,572 assessed plots, covering approximately 65.4 hectares, that intersected areas recorded as deforested during 2021–2022.
Viewed against hundreds of thousands of plots, this is not evidence that Ecuadorian cocoa as a whole is driving widespread recent deforestation.
But from a regulatory perspective, percentages can be misleading.
EUDR due diligence operates much closer to the level of individual production plots and consignments. A relatively small number of problematic farms can therefore become significant when cocoa from those farms enters an otherwise compliant supply chain.
The implication is important: national-level deforestation statistics alone cannot determine whether a cocoa shipment is compliant.
The question eventually becomes much more specific:
Was this cocoa produced on this plot, and was that plot forest-free after the EUDR cutoff?
A rapidly changing forest-risk context
The broader forest landscape also deserves attention.
Using the European Commission Joint Research Centre’s Tropical Moist Forest dataset, the assessment found national forest loss increasing from approximately 4,913 hectares in 2021 to 12,232 hectares in 2022, falling slightly to around 11,013 hectares in 2023, then rising sharply to approximately 45,367 hectares in 2024.
The spatial pattern is equally important. Forest loss is not distributed uniformly across Ecuador. The report identifies Esmeraldas as the province with the highest cumulative deforestation among the provinces examined, suggesting that due diligence cannot rely on one uniform monitoring strategy across the country.
A cocoa plot in a stable agricultural landscape and another close to an active forest-conversion frontier may both need geolocation and documentation, but they do not necessarily require the same level of monitoring.
That points toward a more practical approach to EUDR implementation: risk-based verification rather than treating every cocoa farm identically.
Protected forests reveal a second kind of risk
Deforestation is only one part of the picture.
The assessment also compared cocoa plots against Ecuador’s mapped Permanent Forest Reserves. Around 2.19 million hectares are represented in the reserve dataset used by the study, and the overlay identified 184 cocoa plots covering approximately 527 hectares that intersect these reserve areas.
This finding illustrates an often-overlooked aspect of commodity compliance.
A plantation may show no recent forest clearance and still raise a due-diligence concern if it occupies land where agricultural production conflicts with applicable land-use restrictions.
For companies building EUDR systems, satellite deforestation monitoring is therefore not enough. Plot screening increasingly needs to combine several layers: land cover, forest-loss history, cadastral information, protected areas and other relevant legal boundaries.
The challenge becomes less about producing a single map and more about assembling an evidence stack around every production location.
What plot-level evidence looks like in practice
A case study from Agrícola del Litoral in Los Ríos Province offers a useful illustration.
Three parcels covering approximately 243.6 hectares were evaluated using cadastral information, protected-area data and satellite imagery. Planet imagery from September 2019 and May 2025 indicated that the parcels were already in agricultural use before the EUDR cutoff and remained agricultural afterwards. The nearest mapped forest reserve was approximately 27 kilometres away, with no overlap identified in the available dataset.
The significance of the example is not the individual farm.
It is the method.
Instead of asking a supplier simply to declare that its cocoa is deforestation-free, the process builds a reproducible file containing parcel boundaries, historical imagery, land-status information and protected-area screening.
That is much closer to what credible commodity due diligence increasingly requires: evidence that another analyst, buyer or auditor can reproduce.
From cocoa mapping to an evidence system
This is where many traceability programs encounter their real bottleneck.
Companies may already possess farmer lists, GPS points, certification records or sourcing contracts. But those datasets are often stored separately. Plot identifiers change between systems. Polygons may contain errors. Legal documents are held offline. Satellite assessments may not be linked back to specific suppliers or shipments.
The report proposes a workflow starting with a stable plot registry, followed by geolocation quality assurance, deforestation and reserve screening, legality documentation, risk classification, evidence archiving and continuous monitoring.
This represents an important shift in thinking.
Traceability should not simply answer “Who is the farmer?”
It should eventually answer:
Which plot produced the cocoa, what is the land history of that plot, what legal evidence supports production there, what risks were detected, what mitigation was undertaken, and which shipment contains the resulting cocoa?
Digital systems can make that process scalable. The report describes the use of integrated geolocation, automated forest-loss screening, protected-area and cadastral overlays, supply-chain connections and standardized reporting as components of an EUDR-oriented due-diligence architecture.
Technology, however, cannot fix unreliable source data by itself. The report explicitly notes that field mapping, farmer engagement and clear rules over data ownership and editing remain essential foundations.
The opportunity for Ecuador
Perhaps the most important conclusion from the assessment is that Ecuador’s cocoa challenge should not be framed simply as a deforestation problem.
The analysis does identify post-2020 forest-loss overlaps and cocoa plots intersecting protected forest areas. Those cases deserve investigation.
But the larger structural challenge is turning fragmented spatial, cadastral and supply-chain information into verifiable plot-level evidence.
That is also where the opportunity lies.
Ecuador already has national agricultural datasets, environmental information, a strong export-oriented cocoa sector and increasingly sophisticated private traceability initiatives. The next step is connecting these pieces.
For exporters and buyers, this means improving polygon quality, validating supplier locations, screening historical land-use change and building stronger links between farm data and physical cocoa flows.
For government agencies, it means improving interoperability among agricultural, cadastral and environmental datasets.
And for smallholders, it means ensuring that the transition toward stricter documentation does not simply exclude producers whose land tenure is legitimate but poorly represented in formal digital systems.
The report’s broader conclusion captures the moment well: Ecuador combines strong cocoa-market opportunities with remaining gaps around land tenure information and isolated instances of cocoa associated with recently cleared or protected land.
The future of EUDR-ready cocoa may therefore depend less on producing another sustainability declaration and more on something much more concrete:
building a chain of evidence—from the cocoa tree, to the plot, to the supplier, to the shipment.
And in an increasingly regulated commodity market, that evidence may become as valuable as the cocoa itself.
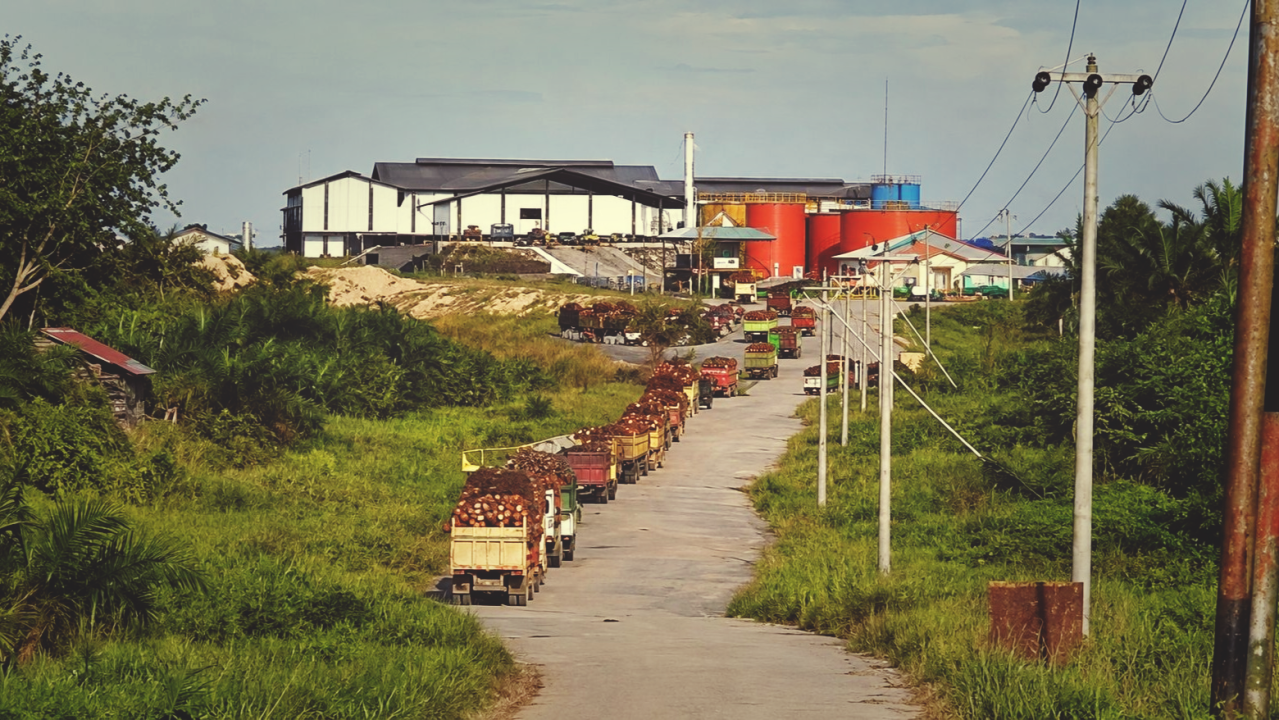
A palm oil mill can seem very far from a supermarket shelf in Europe. In reality, it is one of the most important links connecting tropical production landscapes with the companies, products and consumers at the other end of the global supply chain.
A bottle of shampoo in Amsterdam, a biscuit in Berlin, or an industrial ingredient arriving at the Port of Rotterdam may have traveled through a chain that began thousands of kilometers away, among oil palm plantations in Indonesia or Malaysia. Fresh fruit bunches are harvested and delivered to a palm oil mill, where they are processed into crude palm oil or palm kernel products. From there, the oil may pass through refiners, crushers, traders, ports, manufacturers, and distributors before appearing in food, cosmetics, oleochemicals, animal feed, household products, or energy markets. By the time it reaches Europe, its physical journey can be long, but its information trail can be even more complicated.
For more than two decades, the palm oil industry has been trying to make that journey more visible. One of the most influential efforts began in 2004 with the creation of the Roundtable on Sustainable Palm Oil, or RSPO, a global non-profit, voluntary membership organization founded by stakeholders including WWF, the Malaysian Palm Oil Association, Unilever, Migros, and AAK. Rather than representing a single part of the industry, RSPO brought growers, processors, and traders, consumer-goods manufacturers, retailers, financial institutions, and civil-society organizations around the same table. Its ambition was to build a global framework under which palm oil could be produced and traded while reducing environmental and social harm.
Over time, that ambition evolved into standards that reach far beyond a simple certification label. The RSPO Principles and Criteria address how plantations are developed and managed, how forests and areas of high conservation and carbon value are protected, how workers and local communities are treated, and how companies demonstrate responsible production. The current 2024 Principles and Criteria, now at Version 4.2, retain safeguards addressing deforestation and incorporate approaches such as High Conservation Value and High Carbon Stock assessments, alongside stronger attention to human-rights due diligence. RSPO has prohibited conversion of primary forests since its early standards and has applied broader no-deforestation requirements based on HCV and HCS approaches since November 2018.
Certification, however, is only one part of the sustainability architecture that has developed around palm oil. During the past decade, many companies have also adopted NDPE — No Deforestation, No Development on Peat, and No Exploitation — commitments. The concept is straightforward in words but demanding in practice. Forests should not be cleared for new commodity production; new plantations should not be established on peat; and workers, indigenous peoples, local communities, and smallholders should not be exploited. Implementing these commitments has required companies to understand not only who they buy from, but what is happening within their suppliers’ production landscapes. Tools such as HCV and HCS assessments, satellite monitoring, grievance systems, supplier engagement, and the NDPE Implementation Reporting Framework have emerged to translate corporate commitments into something that can be monitored across complex supply bases.
This is where a seemingly modest piece of information becomes surprisingly important: the mill list.
A palm oil mill sits at a strategic point in the supply chain. It receives fruit from plantations and smallholders across a surrounding sourcing area, then passes processed palm products onward to refineries and traders. Knowing which mills supply a company does not tell us everything about where its palm oil originated, but it provides a crucial first map of the upstream supply chain. Without that map, tracing thousands of tonnes of palm-derived products back toward plantations becomes far more difficult.
RSPO recognized this gap before today’s regulatory debate over deforestation traceability had fully emerged. At its 15th General Assembly in 2018, RSPO members adopted Resolution GA15-6b, establishing the expectation that supplying mill lists should be made publicly available. The requirement covers both RSPO-certified and non-certified supplying mills. RSPO later created the Mill List functionality within MyRSPO, allowing companies to submit a file or a public URL and making the information visible through their membership profiles. RSPO currently asks members to submit mill lists for each half-year reporting period.
Importantly, this expectation does not stop with companies that purchase crude palm oil directly from mills. RSPO’s guidance makes clear that transparency is also expected from downstream actors such as traders, manufacturers, and retailers. A company buying refined palm oil or a palm-derived ingredient may never have a commercial relationship with an individual mill, yet it is still expected to work through its suppliers to identify the mills behind the material it buys. RSPO guidance identifies information such as the mill name, country, GPS coordinates, and parent company as part of that transparency chain. Even Supply Chain Associates and companies purchasing relatively small volumes fall within the mill-list transparency expectation.
That makes the current picture in Europe striking.
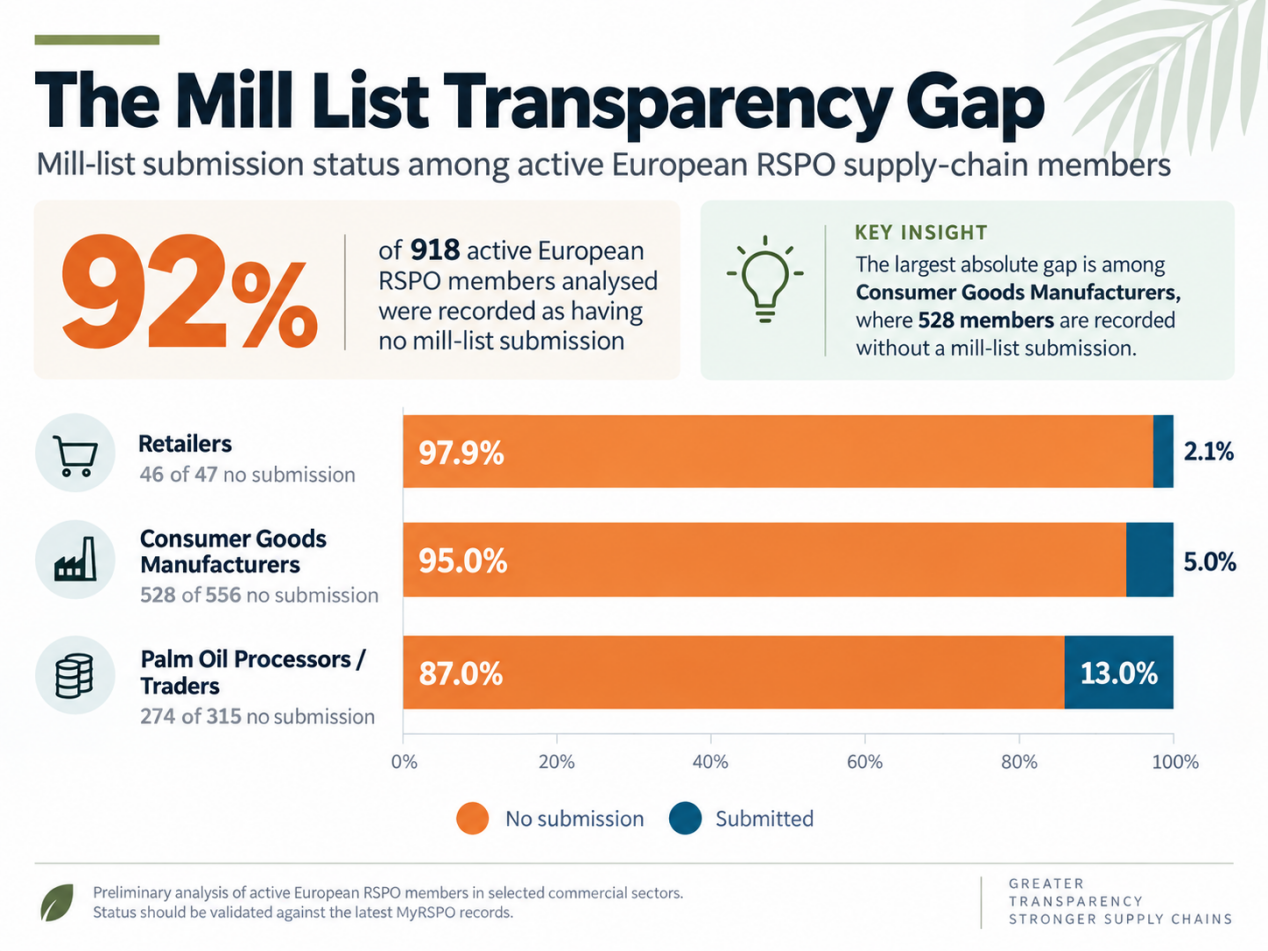
An analysis by MosaiX and Inovasi Digital of the available RSPO ACOP membership dataset examined 918 active European members across three commercially significant groups: palm oil processors and traders, consumer-goods manufacturers, and retailers. Of those companies, 848—approximately 92 percent—were recorded as having “No Submission” for their mill list in the dataset analyzed. Among processors and traders alone, 274 of 315 active European members were recorded without a submission.
The figures require caution. They represent a snapshot of the dataset rather than a formal determination of compliance, and individual records should be checked against the most recent information held by RSPO. “No Submission” can also reflect differences in reporting periods, updates, or administrative circumstances. The analysis should therefore be read as an indication of a possible transparency gap rather than a judgment on individual companies.
Even with that qualification, however, the scale of the apparent gap raises an important question. If European companies struggle to identify the mills behind their palm oil today, how easily can they make the much deeper journey toward the plantation tomorrow?
That question has become more urgent because Europe’s regulatory landscape has changed dramatically since RSPO adopted its mill-list resolution in 2018. Under the EU Deforestation Regulation, or EUDR, oil palm is one of the commodities covered by a new system of mandatory due diligence. Relevant products entering or leaving the EU market must meet deforestation-free and legality requirements. The regulation uses 31 December 2020 as its deforestation cut-off date and introduces geographic traceability to the land where covered commodities were produced. For plots larger than four hectares for relevant commodities other than cattle, the regulation’s geolocation definition provides for polygons describing the perimeter of the production plot.
Following amendments to the regulation, the main obligations are scheduled to apply to large and medium-sized operators from 30 December 2026, while most micro and small operators follow from 30 June 2027. That places European palm-oil supply chains at an unusual moment: a transparency principle developed largely through voluntary sustainability initiatives is now meeting a regulatory system built around evidence, geolocation, and due diligence.
RSPO certification and EUDR should not be confused. Neither RSPO membership nor a published mill list automatically proves EUDR compliance. The European Commission’s guidance is explicit that certification systems may support risk assessment and information gathering, but operators remain responsible for ensuring that the full requirements of the regulation are met. Among other things, EUDR traceability reaches beyond mills to the plots of land where the commodity was produced. Supply-chain models that allow material of known and unknown origin to be mixed cannot simply substitute for the traceability information required under the regulation.
Yet the two systems increasingly intersect. A credible mill list can form a bridge between a company’s commercial purchasing records and the landscapes from which its palm oil originates. Once mills are identified, supplier relationships can be organized around them. Mill identities and coordinates can be checked. Parent-company ownership can be established. Sourcing areas can begin to be mapped. Plantation polygons and smallholder origins can then be connected progressively to the mill. Satellite monitoring can be applied to those production areas, while deforestation, peat, fire, legality, and social risks can be assessed more systematically.
In this way, the mill list stops looking like an administrative spreadsheet and begins to resemble something more important: the first layer of supply-chain infrastructure.
That infrastructure also connects several generations of sustainable palm oil practices. RSPO provides certification, standards, and a multistakeholder framework. NDPE commitments extend corporate responsibility across deforestation, peat, and exploitation risks. HCV and HCS approaches help distinguish areas that should be protected. Supply-chain certification and systems such as PalmTrace help follow certified material through processing and trade. Satellite monitoring increasingly makes it possible to observe land-use change from space. Grievance and supplier-engagement processes create mechanisms for responding when problems are identified. Smallholder programs seek to ensure that increasingly sophisticated traceability systems do not simply exclude farmers who lack technology or documentation. Together, these measures reflect an industry that is gradually moving from asking whether palm oil is “sustainable” toward asking whether its environmental and social claims can actually be demonstrated.
The EUDR accelerates that evolution. It brings a regulatory demand for traceability into a sector that has already spent years building voluntary systems for certification, transparency, and responsible sourcing. Rather than treating RSPO, NDPE, and EUDR as competing frameworks, there is an opportunity to see them as different layers of the same journey. Certification establishes production and supply-chain standards. NDPE adds broader expectations for companies and suppliers. Regulation creates legally defined market requirements. The common currency among all three is increasingly credible data about origin.
This is also why the apparent European mill-list gap should not be viewed only as a problem of reporting. For some downstream companies, identifying mills is genuinely difficult. A European manufacturer may purchase an emulsifier or a specialty ingredient rather than crude palm oil. Its immediate supplier may purchase from another manufacturer, which in turn buys from several refiners. One refinery can receive material linked to many mills, and mill names themselves may appear differently across datasets because of abbreviations, subsidiaries, acquisitions, or ownership changes. Coordinates can be missing or inaccurate. The same mill can appear several times under slightly different names. A list assembled from multiple suppliers can rapidly grow into hundreds or even thousands of records.
These are not reasons to abandon transparency. They are reasons to make it easier.
There is an opportunity for RSPO and its members to treat the gap as a collective implementation challenge. Rather than simply reminding companies that mill lists are expected, a collaborative support mechanism could help downstream members turn fragmented supplier information into reliable, standardised, and regularly updated datasets. Mill identities could be matched against reference databases, coordinates validated, duplicate facilities resolved, and parent-company relationships checked. Where suppliers cannot immediately provide complete information, engagement could focus on progressively improving traceability rather than creating a simple pass-or-fail exercise.
Such support could also create a natural pathway beyond the mill. Once a company has a reliable picture of its supplying mills, the same information architecture can support plantation mapping, EUDR geolocation requirements, deforestation screening, NDPE monitoring, monitoring and wider climate and nature risk assessments. What begins as fulfilling an existing RSPO transparency commitment can therefore become a practical entry point into much more sophisticated responsible-sourcing systems.
This is where organisations operating on both sides of the supply chain may have a useful role to play. MosaiX and Inovasi Digital combine proximity to European companies with extensive experience working with palm-oil mills, corporate groups, geospatial information and production landscapes in Southeast Asia. In a potential collaboration with RSPO, that capability could be used not to create another sustainability standard, but to help members implement an existing one more effectively — connecting supplier data held in European offices with the physical mills and landscapes from which palm oil originates.
The most useful outcome would not simply be a higher number of spreadsheets uploaded to MyRSPO. It would be a stronger information bridge running from consumer markets back toward production landscapes: from a European buyer to its supplier, from the supplier to a refinery, from the refinery to its mills, and eventually from those mills to plantations and smallholders.
Twenty years ago, much of the sustainable palm oil debate centred on whether environmental and social standards could coexist with a global commodity industry. Today, the question is increasingly about evidence. Where did this material come from? Which mill processed it? Which land produced it? Was forest cleared? Was peat converted? Were people’s rights respected? And can a company demonstrate the answers rather than simply state them?
RSPO helped place transparency at the centre of sustainable palm oil long before these questions became regulatory requirements in Europe. The apparent gap in mill-list disclosure suggests that the principle is established, but the practical work of making entire supply chains visible is far from finished.
Closing that gap could therefore mean more than improving compliance with an RSPO reporting requirement. It could provide thousands of downstream companies with the first reliable coordinates on a much longer journey — one that leads from the factory floor and supermarket shelf in Europe all the way back to the forests, farms, communities and mills where the palm oil story begins.
And in an era of EUDR, NDPE and increasingly evidence-based sustainability, knowing that journey may become as important as the commodity itself.
References
RSPO — Mill List Submission.Current RSPO information on GA15-6b, mill-list requirements and submission periods. RSPO Mill List Submission
RSPO — Resolution GA15-6b (2018): Requiring members involved in primary procurement to publish third-party supplying mills lists.The original resolution explains the rationale for public mill disclosure and supply-chain scrutiny. RSPO Resolution GA15-6b
RSPO — Mill List Submission in MyRSPO.Explains the required information, including mill name, country, GPS coordinates and parent company, and the publication of submissions through RSPO member profiles. Mill List Submission in MyRSPO
RSPO — Frequently Asked Questions on Mill List Submission.Clarifies requirements for indirect buyers, Supply Chain Associates, manufacturers and retailers, and addresses implementation and certification implications.
RSPO — Guide on Mill List Submission.Provides the operational process for submitting mill lists through MyRSPO and confirms that lists may be uploaded as a file or URL.
European Commission — Regulation on Deforestation-free Products.Official overview of EUDR objectives, commodities covered and current implementation dates. European Commission: EUDR
European Union — Regulation (EU) 2023/1115, consolidated text.Official legal text covering due diligence, geolocation and requirements for deforestation-free commodities and products. EUR-Lex: Regulation EU 2023/1115
European Commission, 13 July 2026 — Commission updates product scope and tools to support EUDR.Confirms the current application dates of 30 December 2026 and 30 June 2027 and provides updated implementation context. European Commission EUDR Update, July 2026
MosaiX & Inovasi Digital preliminary analysis, September 2026.Analysis of the supplied RSPO membership dataset covering active European members, membership sectors and recorded Mill List Submission status. This should be treated as a preliminary analytical dataset rather than an official RSPO compliance determination.
At a palm oil mill, the most visible signs of production are easy to recognize: trucks carrying fresh fruit bunches, steaming sterilizers, piles of fibre and shell, and tanks filling with crude palm oil. One of the industry’s important climate risks, however, is almost invisible. It rises quietly from wastewater ponds.
Palm Oil Mill Effluent, usually known as POME, contains large amounts of organic matter. When it decomposes under anaerobic conditions, particularly in conventional open ponds, it produces biogas rich in methane. Studies comparing POME treatment systems have consistently shown that capturing this gas can substantially improve the climate performance of palm oil production, while also turning a waste stream into a source of energy. Research in Indonesia and Malaysia has found environmental advantages from biogas recovery compared with conventional lagoon treatment, including avoided greenhouse-gas emissions and opportunities to produce electricity or useful heat.
This matters because methane acts much faster than carbon dioxide in warming the atmosphere, and reducing methane can therefore make a meaningful contribution to near-term climate mitigation. In palm oil, the opportunity is unusually tangible. Unlike some difficult-to-abate agricultural emissions, methane from POME is concentrated around a processing facility where technologies such as covered lagoons, digesters, flaring systems and biogas engines already exist.
Yet the technology is far from universal.
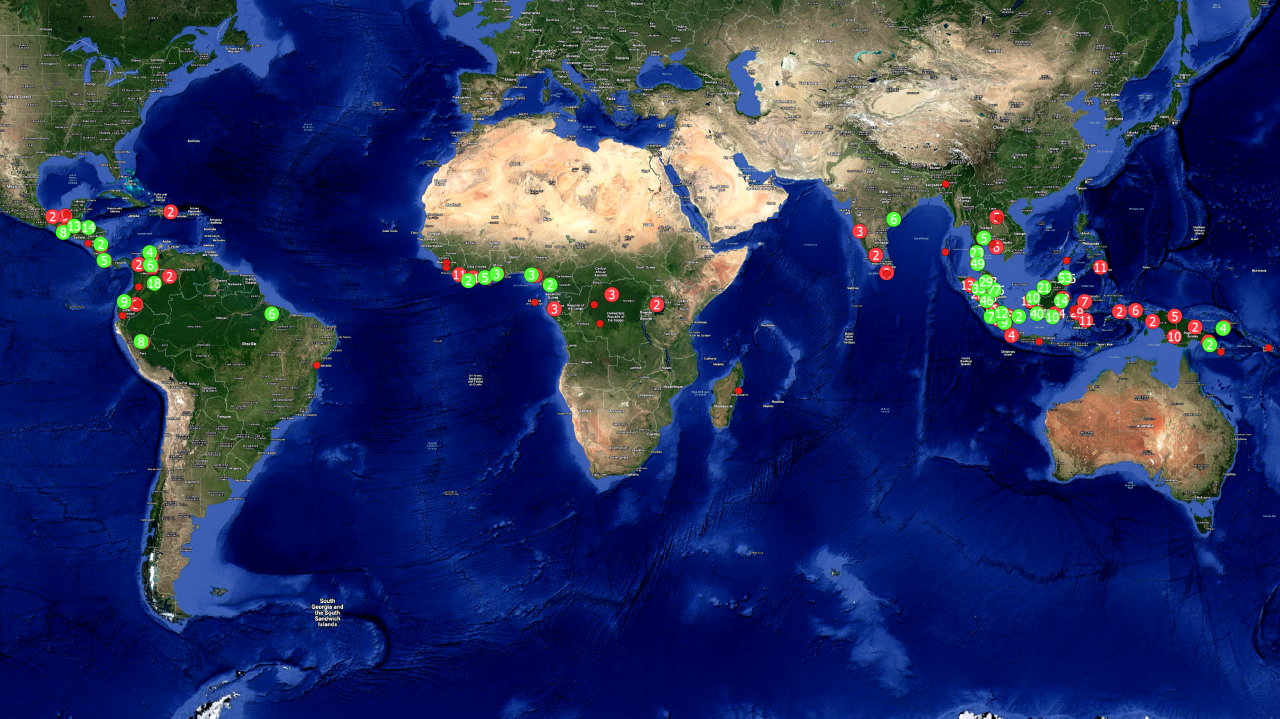
A recent review of the Earthqualizer Foundation and Inovasi Digital palm oil mill database found 2,496 mills recorded as active globally. Only 567, around 23 percent, were recorded as having a methane capture facility. More than three-quarters were recorded without one, and roughly 1,843 active mills were associated with open-lagoon treatment without methane capture. These figures reflect the current curated database rather than a complete official global census, but the pattern is difficult to ignore: methane capture remains the exception rather than the norm across a large part of the industry.
The gap is especially striking in Indonesia, where only about 11 percent of active mills in the database are recorded with methane capture, compared with substantially higher shares in Malaysia and Thailand. Public information shows that the issue has been recognized for many years. A Global Methane Initiative resource assessment published in 2015 noted that 38 methane-capture projects at Indonesian palm oil mills had been registered under the Clean Development Mechanism. That historical record shows that the technology itself is not new; what remains unresolved is how to scale it consistently across thousands of facilities.
Some individual projects show what that scaling could mean. At Sukajadi Sawit Mekar in Central Kalimantan, a UNFCCC-registered methane-recovery project estimated annual reductions of about 52,125 tonnes of CO₂ equivalent. At Pelakar Mill in Jambi, another project combining methane recovery with electricity generation estimated reductions of roughly 13,446 tonnes of CO₂ equivalent per year. These are project-specific figures rather than values that can be applied to every mill, but they demonstrate that POME methane mitigation can be substantial at facility level.
More recent research also suggests that the climate benefit can be linked with operational value. A 2026 field-scale study of POME-derived biogas used in a palm oil mill boiler reported methane-related mitigation of around 9,579 tonnes of CO₂ equivalent per year alongside a positive operating benefit from substituting part of the mill’s conventional fuel use. The broader lesson is important: methane capture does not have to be seen only as a compliance cost. In the right conditions, it can be part of a mill’s energy and resource-efficiency strategy.
This is becoming more relevant as corporate climate reporting moves deeper into the supply chain. The GHG Protocol’s Corporate Value Chain Standard was designed not simply to total Scope 3 emissions, but to help companies understand where value-chain impacts occur and where reduction efforts should be focused. Its new Land Sector and Removals Standard goes further for agricultural supply chains, providing more specific requirements for companies to account for land-related emissions and removals in their operations and value chains. The standard becomes effective in January 2027 and builds directly on the Corporate and Scope 3 Standards.
For a buyer of palm oil, this changes the meaning of Scope 3. A corporate carbon number is useful, but it tells only part of the story. What matters operationally is whether that number can be traced back to the plantations, mills and management practices that created it. Two mills processing similar volumes of fruit may have very different climate footprints depending on their sourcing, land-use history, fertilizer use, transport patterns and POME management. When those differences become visible, Scope 3 reporting starts to become a tool for deciding where action is possible rather than simply documenting what has already happened.
Methane Signals Around Palm Oil Mills With and Without Methane Capture Facilities
Satellite data may provide another piece of that picture. As an exploratory assessment, we compared 100 Indonesian mills recorded with methane capture and 100 without, using methane observations from the Copernicus Sentinel-5P TROPOMI instrument for 2025 and 2026. For each mill, atmospheric methane around the facility was compared with a wider regional background. Among observations that passed the quality filters, mills without methane capture showed a higher average methane enhancement than the group with methane capture.
The result is intriguing, but it requires caution. Sentinel-5P measures the concentration of methane in the atmospheric column, not the tonnes of methane emitted by an individual facility. The official Earth Engine documentation also notes retrieval limitations, including noise, striping and uncertainty in individual observations. TROPOMI was designed to help observe atmospheric methane patterns and support modelling of sources and sinks; it should not be treated as a direct meter attached to a palm oil mill.
Its value may instead lie in adding an independent layer of observation. A mill database may say that a methane capture system exists. Operational data may estimate how much methane should be destroyed. Satellite observations can help ask a different question: does the surrounding atmosphere show a pattern that is consistent with that expectation? If the answer is unexpected, it can guide a closer investigation rather than deliver an automatic verdict.
This is where MosaiX and Inovasi Digital see a broader role for supply-chain intelligence. Their work combines mill and supplier traceability, plantation and land-use information, GHG assessment, methane-capture facility data, transport analysis and geospatial monitoring. The aim is not to replace company primary data or engineering measurements, but to connect otherwise fragmented information so that climate reporting becomes more specific to actual suppliers and places.
In practice, that means helping companies understand which mills in their sourcing network have open lagoons, which already have methane capture, where emission estimates are highest, and where independent spatial evidence suggests further verification may be useful. It also means connecting methane with the rest of the Scope 3 picture, including land-use change, peat, fertilizer use, transport and carbon removals. The GHG Protocol itself increasingly emphasizes the importance of consistent, traceable and decision-useful information for agricultural value chains.
The challenge ahead is not only technological. Methane capture projects require capital, reliable operation, competent maintenance and a reason for the mill to keep the system functioning after installation. Buyers may benefit from lower Scope 3 emissions, while the investment has to be made upstream. Banks may see a small infrastructure project, while a consumer-goods company may see a climate target. Governments may see renewable energy, wastewater treatment or rural electricity. Each party is looking at the same pond from a different angle.
That is why collaboration matters. The most promising opportunity may be to connect these interests around real facilities: producers that can reduce emissions, buyers that need credible Scope 3 reductions, technology providers that can deliver the infrastructure, and financial institutions that can help make the economics work. Malaysia’s experience with POME biogas has already been described in the scientific literature as involving not only technology, but also public-private cooperation, financial mechanisms and institutional support.
The methane rising from a palm oil mill lagoon is invisible, but the opportunity is increasingly visible. The industry already knows the chemistry. It already has proven technologies and decades of project experience. What is still missing at scale is the connection between supply-chain data, climate accounting, investment and implementation.
For Scope 3 reporting, that may be the more important lesson. Better measurement should not simply produce a more precise footprint. It should help reveal where a tonne of emissions can actually be avoided.
The global mill and methane-capture figures and the 200-mill satellite comparison cited above are based on Inovasi Digital analysis, 2026. They are presented as supply-chain intelligence and screening results, not as an official global census or direct satellite measurement of facility-level methane emissions.
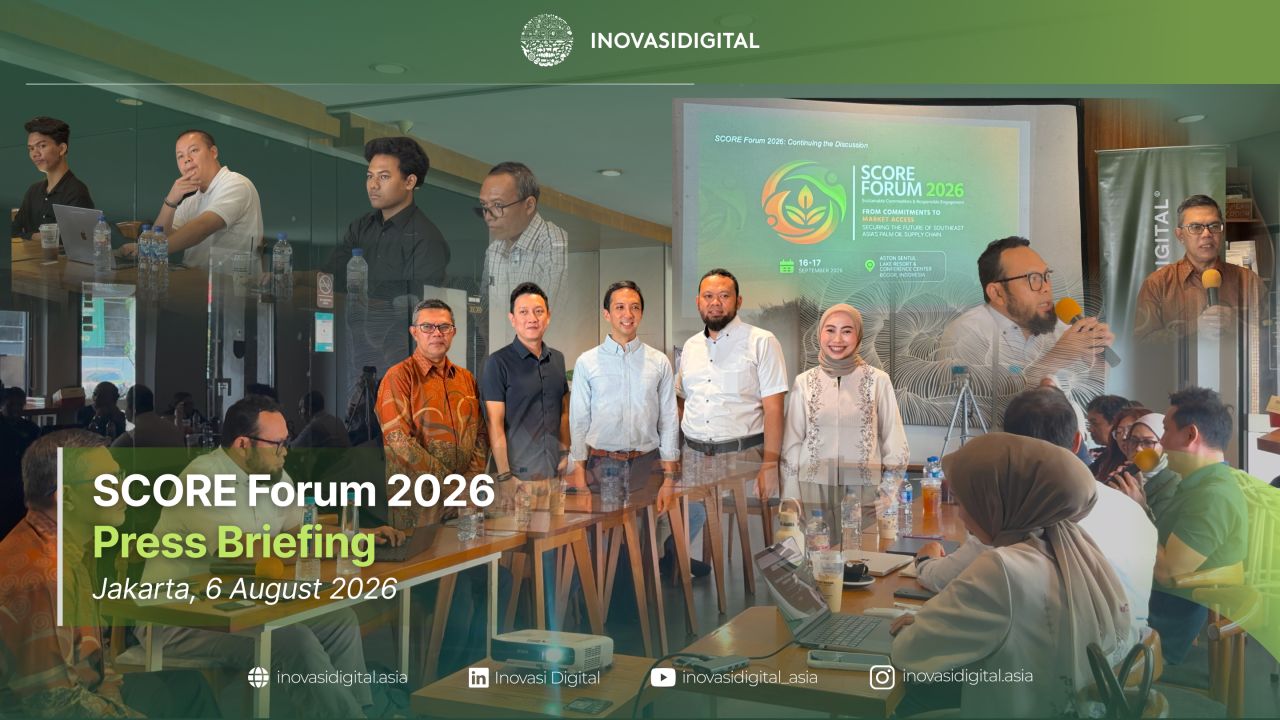
With less than a week to go, SCORE Forum 2026 will bring palm oil industry leaders and sustainability practitioners together in Bogor to examine a question that is becoming increasingly important: what happens after supply chain risks are identified?
Bogor, Indonesia — 10 September 2026. Over the past decade, No Deforestation, No Peat and No Exploitation (NDPE) commitments have become an important foundation of responsible palm oil sourcing. Across the industry, companies have invested in sustainability policies, supplier requirements, traceability systems and satellite-based monitoring to better understand where palm oil comes from and where environmental and social risks may occur.
But identifying risk is only the beginning.
As sustainability expectations move increasingly from corporate commitments toward measurable implementation, the challenge facing the palm oil sector is changing. Companies must not only know where risks exist, but also determine what happens next: how suppliers respond, how improvements are verified, how historical problems can be addressed, and how responsible suppliers can remain connected to global markets.
This transition — from commitment to implementation, and ultimately to market access — will be at the centre of the Sustainable Commodities & Responsible Engagement (SCORE) Forum 2026, taking place on 16–17 September 2026 at ASTON Sentul Lake Resort & Conference Center in Bogor, Indonesia. The official forum theme, From Commitments to Market Access, reflects a growing recognition that sustainability is becoming closely connected to supply chain resilience, competitiveness and access to international markets.
Convened by Earthqualizer and Inovasi Digital, SCORE Forum is designed as a working platform for actors across the palm oil value chain. Growers, processors, traders, consumer-goods companies, financial institutions, policymakers, technology providers and sustainability practitioners will come together to explore practical approaches to responsible sourcing and supply chain transformation.
A central question running through the Forum is deceptively simple: What can companies and suppliers practically do once a sustainability risk has been identified?
For years, much of the sustainability conversation has understandably focused on detecting deforestation, mapping supply chains and identifying non-compliance. These systems remain essential. Yet monitoring alone does not restore forests, improve supplier practices or strengthen smallholder livelihoods. Nor does simply removing a supplier from one supply chain necessarily resolve the underlying environmental or social problem.
The next stage of NDPE implementation therefore requires greater attention to supplier engagement, corrective action, recovery and responsible re-entry. The objective is not to weaken sustainability standards, but to create credible mechanisms through which suppliers can stop non-compliant practices, address past impacts, demonstrate measurable improvement and rebuild access to responsible markets.
That discussion is becoming even more relevant as regulatory and market expectations evolve. Traceability, geolocation, deforestation monitoring and evidence-based due diligence are increasingly becoming part of the infrastructure required for market access. At SCORE Forum, sessions will examine responsible supply chains, traceability and monitoring, forest protection and restoration, as well as the implications of changing governance and market requirements.
The programme will combine plenary discussions, moderated panels, technical workshops, multi-stakeholder dialogue and practical Industry Clinics. Topics include NDPE performance, EUDR readiness, traceability systems, ESG reporting and access to financing, creating an opportunity to connect sustainability ambition with the operational and financial realities faced by companies and suppliers.
The Forum will also bring together perspectives from across the regional and international palm oil sector. Confirmed speakers include representatives from Roundtable on Sustainable Palm Oil (RSPO), PT Danantara Sumberdaya Indonesia (DSI), the Malaysian Palm Oil Board (MPOB), the Council of Palm Oil Producing Countries(CPOC), Unilever, Musimmas, Wilmar, Apical, SD Guthrie, Fuji Oil, Bumitama and other organisations spanning production, processing, markets and sustainability.
Within this wider ecosystem, MosaiX contributes a supply-chain intelligence and technology perspective to the transformation challenge. Its work connects traceability and supplier intelligence with deforestation and land-conversion monitoring, NDPE risk assessment and recovery, climate and nature risk intelligence, and smallholder and landscape-level interventions.
The value of these systems increasingly lies not simply in producing another risk map or dashboard, but in connecting information with decisions. A deforestation alert needs to lead to supplier engagement. A traceability gap needs to trigger data improvement. A historical liability needs a credible recovery process. Climate or biodiversity risks need to inform investment and sourcing decisions. And smallholders need pathways that allow them to participate in responsible markets rather than becoming unintended casualties of increasingly complex compliance requirements.
This is where collaboration becomes critical.
No single company, monitoring platform, certification system, financial institution or government agency can transform a commodity supply chain alone. Environmental risks often extend beyond concession boundaries, while suppliers can serve multiple buyers and smallholders frequently operate through complex networks of dealers, mills and intermediaries. Solutions therefore have to work across companies and across landscapes.
SCORE Forum 2026 aims to create space for precisely that conversation: moving beyond the question of who has a sustainability commitment toward the more difficult questions of how those commitments are implemented, how progress is demonstrated, and how transformation can be sustained commercially over time.
Ultimately, the future of responsible palm oil may depend less on adding another commitment and more on making existing commitments work — connecting data with action, risk with recovery, and sustainability performance with continued market access.
On 16–17 September in Bogor, SCORE Forum will bring those conversations into the same room.
SCORE Forum 2026 — From Commitments to Market Access 16–17 September 2026 | ASTON Sentul Lake Resort & Conference Center, Bogor, Indonesia
The European Union Deforestation Regulation (EUDR) enacted through Regulation (EU) 2023/1115 shifts the compliance basis for agricultural commodities from document-based traceability to geolocation evidence and land history verification. Coffee, alongside cocoa, palm oil, soy, rubber, timber, and cattle, must now be demonstrably free of association with deforestation or forest degradation after the cut-off date of 31 December 2020.
This article presents the results of a Deforestation Risk Assessment (DRA) and forest-to-coffee conversion analysis for the period 2001–2024 across three major coffee-producing provinces in Vietnam’s Central Highlands: Dak Nong, Lam Dong, and Dak Lak. The assessment is not designed to render a legal verdict on Vietnamese coffee. It is a prioritisation tool — a framework that helps supply chain actors identify where evidence needs strengthening, where geolocation verification should be prioritised, and how compliance resources can be deployed proportionally.
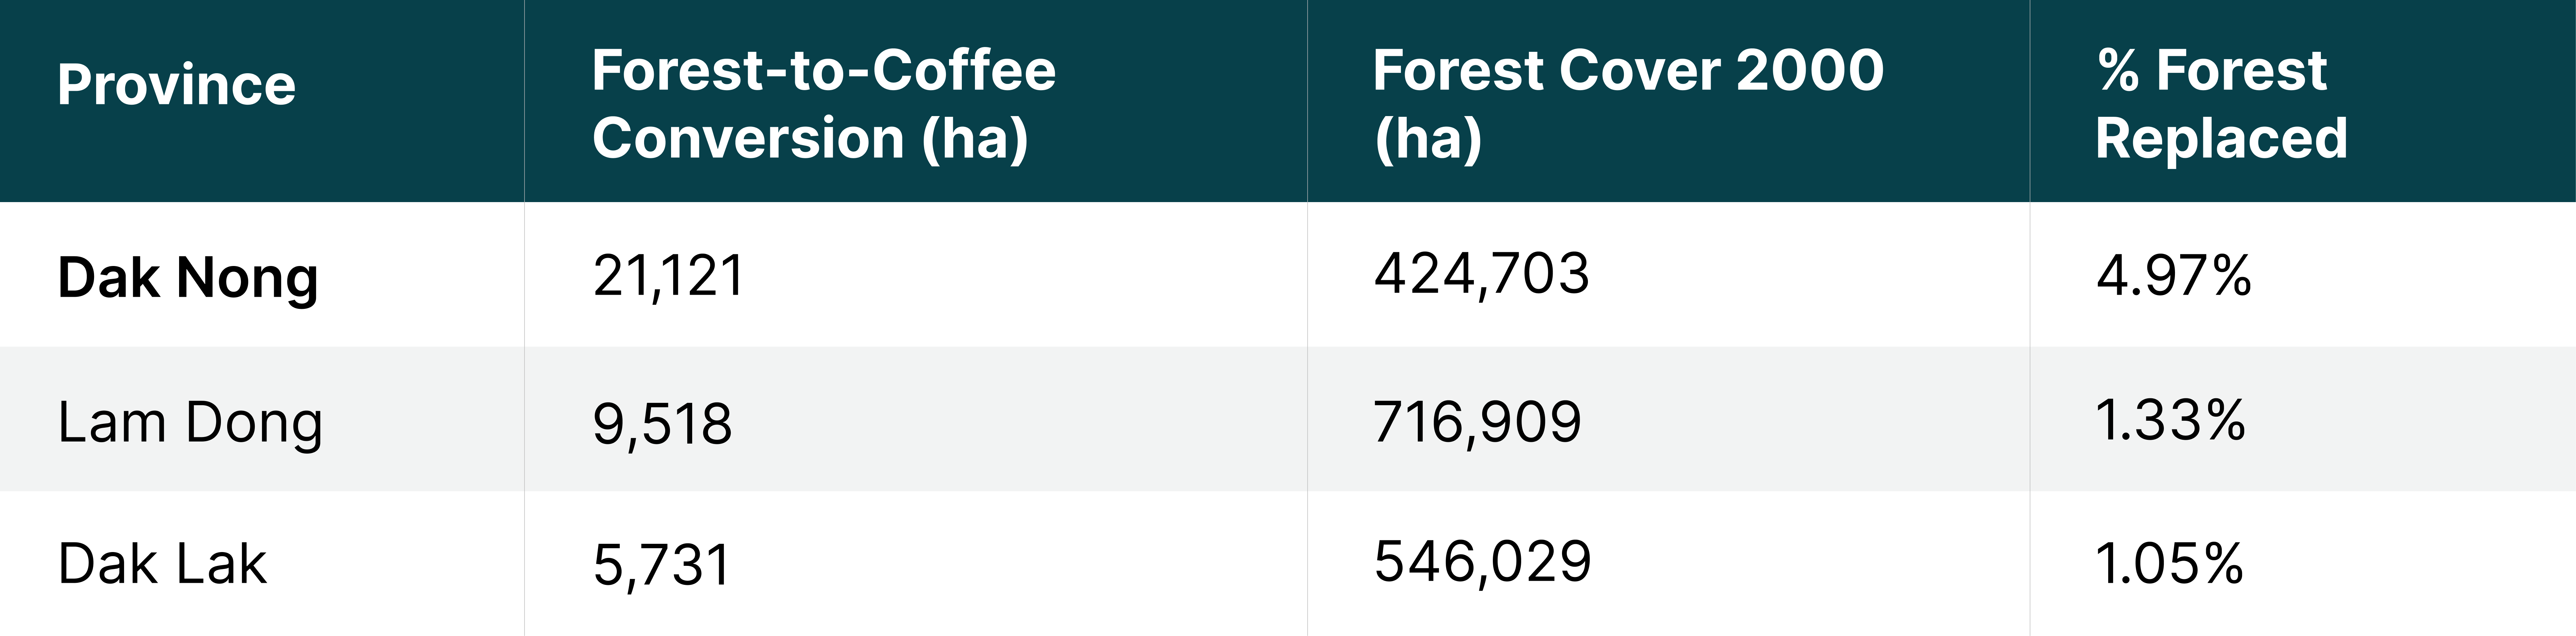
Results reveal sharp differences across provinces and districts. Dak Nong recorded the largest conversion: 21,121 ha or 4.97% of its year-2000 forest cover, concentrated in two dominant districts: Dak Song (10,982 ha, 22.58%) and Dak R’Lap (9,272 ha, 7.73%). Lam Dong recorded 9,518 ha with hotspots in Di Linh (5,769 ha) and Bao Lam (3,276 ha). Dak Lak recorded 5,731 ha with high local intensity in Cu M’gar (9.81%) and Krong A Na (7.53%).
This article builds a narrative from the assessment results: reading spatial conversion patterns as a risk-filtering basis, identifying priority districts, and translating analytical findings into operational implications for due diligence, evidence packs, and supplier engagement.
EUDR and the Shift to Spatial Evidence
For years, questions about coffee origin were answered by country name, purchasing region, or cooperative network. Under EUDR, that answer is no longer sufficient. Origin must be demonstrable as a production location tied to specific land, spatially verifiable, and unconnected to deforestation after the 31 December 2020 cut-off.
EUDR requires operators and traders to maintain evidence-backed due diligence statements. For plots larger than four hectares, the perimeter must be described by a polygon; for smaller plots, coordinate points may be used. This means compliance is moving toward precision sourcing: every batch must be traceable to a specific, verifiable production location.
Three evidentiary nodes of EUDR must operate simultaneously: geolocation as the entry gate, deforestation risk analysis as the interpretive layer, and the evidence pack as the auditable output. Without all three, traceability becomes merely a transaction record — not a guarantee of deforestation-free sourcing.
Coordinates only answer ‘where’. The next questions — whether the plot was previously forested, whether there was any tree cover loss after the cut-off, and whether the supply chain is free of blending — can only be answered through systematic spatial analysis.
Assessment Methodology
This assessment employs two complementary analytical layers: (1) a historical forest-to-coffee conversion analysis for the period 2001–2024, and (2) a predictive model-based Deforestation Risk Assessment. Both are grounded in coffee farm geolocation data and consistent forest cover datasets.
1. Forest-to-Coffee Conversion Analysis
The first layer reads what has historically occurred. Tree cover loss data from Hansen et al. (2013) was combined with coffee plantation layers to identify areas where forest was converted to coffee cultivation over a two-decade period. The analysis produces per-province and per-district metrics: absolute conversion area (ha), year-2000 forest cover as baseline, and percentage of forest replaced as a measure of relative intensity.
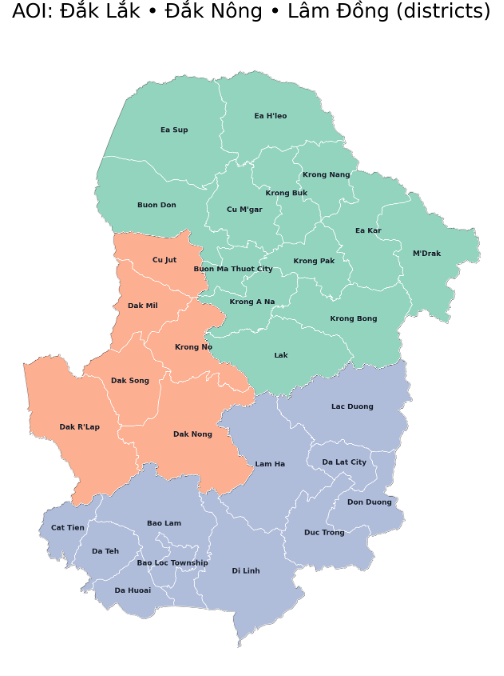
The Area of Interest (AOI) encompasses all districts across the three provinces: Dak Nong, Lam Dong, and Dak Lak. The primary unit of analysis is the administrative district, which provides sufficient resolution for operational prioritisation without losing provincial landscape context.
Figure 1. Area of Interest (AOI): districts in Dak Nong, Lam Dong, and Dak Lak, Vietnam
2. Deforestation Risk Assessment
The second layer constructs a forward-looking risk probability surface. The DRA workflow begins with geolocation data preparation: invalid polygons are corrected, very small artefacts are removed, and plots are clipped to the AOI. A working coffee mask is generated through rasterisation at 100-metre resolution.
The forest baseline is built from historical forest extent minus tree cover loss through the end of the analysis window. Recent loss is read within a five-year rolling window as the model’s target label. Spatial features used include: proximity to settlements (GHSL), permanent water bodies (JRC), coffee plantations (coffee mask), elevation and slope (SRTM), and administrative boundaries (FAO GAUL).
A Random Forest model is trained on balanced samples of recent loss and stable forest. The output is a relative risk probability surface aggregated to approximately 1 km grids and classified into five priority tiers: Low, Medium Low, Medium, Medium High, and High.
Figure 2. Deforestation Risk Assessment (DRA) output: relative risk probability surface classified into five tiers across the AOI
3. Assessment Results: Provincial Overview
At the provincial level, the assessment produces three headline figures that serve as the entry point for risk interpretation. Total indicated forest-to-coffee conversion across the entire AOI reached 36,371 ha — unevenly distributed across three provinces with markedly different profiles.
Table 1. Summary of assessment results by province. Source: Spatial forest-to-coffee conversion analysis, 2001–2024.
Dak Nong dominates with 21,121 ha — more than 58% of total AOI conversion. More significant than the absolute figure is its relative intensity: nearly 5% of all Dak Nong forest cover from the year 2000 has been converted to coffee plantations over two decades. This is an ecologically significant figure and directly relevant to due diligence frameworks.
Lam Dong recorded 9,518 ha at a provincial rate of 1.33%. This lower percentage requires contextualisation with district-level data — Lam Dong’s very large forest base (over 716,000 ha) dilutes the provincial intensity, even as several of its districts contain substantial conversion volumes.
Dak Lak recorded 5,731 ha or 1.05%. As Vietnam’s most iconic coffee province, the comparatively smaller total does not imply uniformly low risk. As shown in the district analysis, several areas of Dak Lak exhibit local intensities strong enough to trigger enhanced due diligence.
Assessment Results: District Analysis and Hotspots
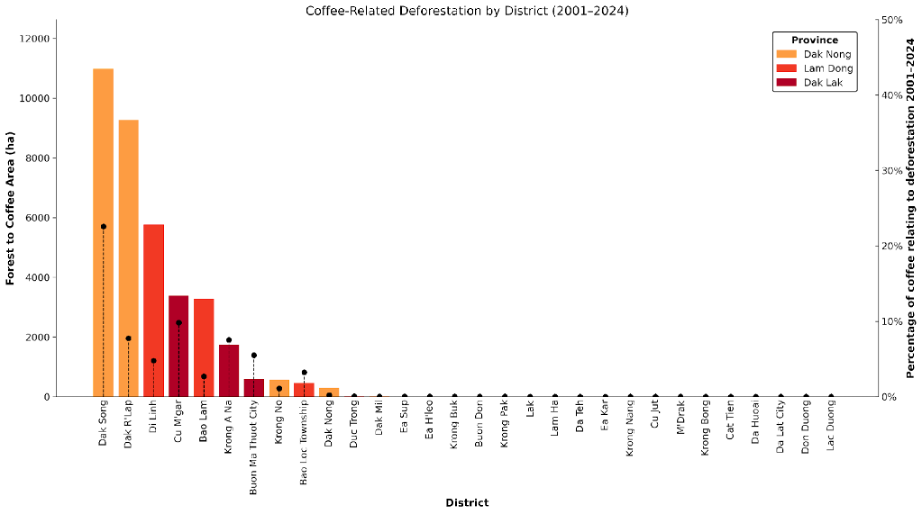
District-level assessment is the most operationally actionable layer. This is where risk differences become sharp enough to support differentiated procurement decisions. Of the 30 districts within the AOI, the majority of conversion is concentrated in just six.
1. Conversion Distribution by District
Table 2. Ten districts with the highest indicated forest-to-coffee conversion
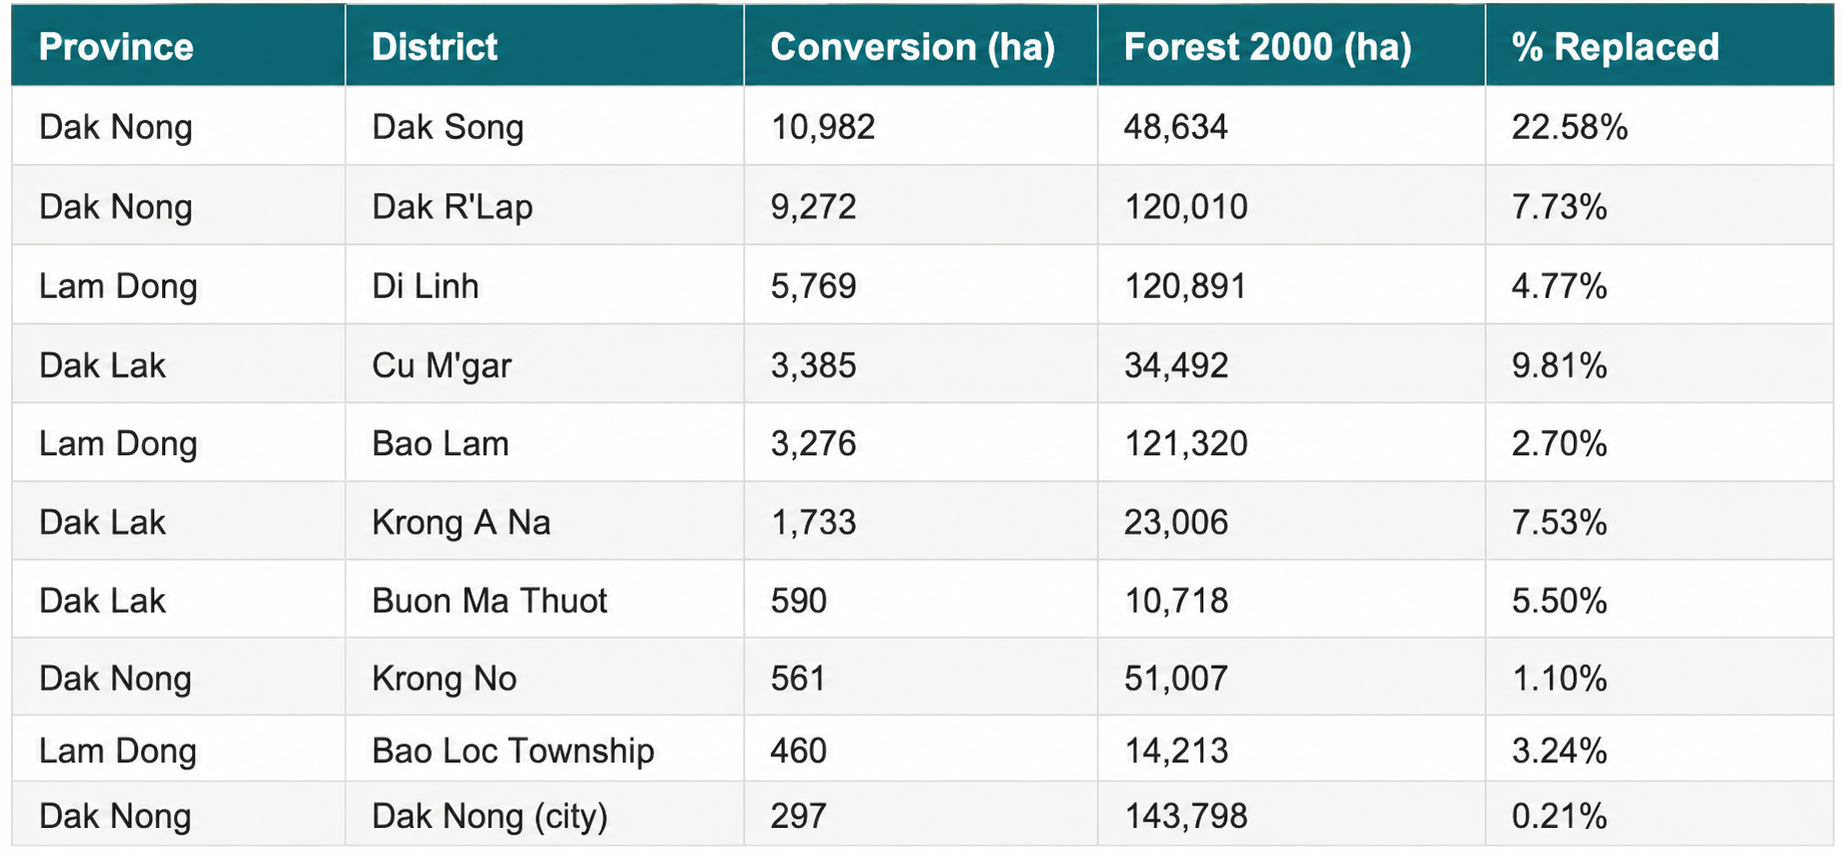
Two districts in Dak Nong — Dak Song and Dak R’Lap — dominate strikingly. Dak Song recorded 10,982 ha of conversion at 22.58% intensity: more than one-fifth of its local forest has changed function. This places Dak Song as the highest-risk district across the entire AOI in both absolute scale and relative intensity.
In Lam Dong, Di Linh recorded 5,769 ha — the third largest in the AOI — though its intensity is more moderate at 4.77%. Cu M’gar in Dak Lak shows 9.81% local intensity, significant because of its smaller forest base (34,492 ha).
2. Reading Two Risk Dimensions: Area vs. Intensity
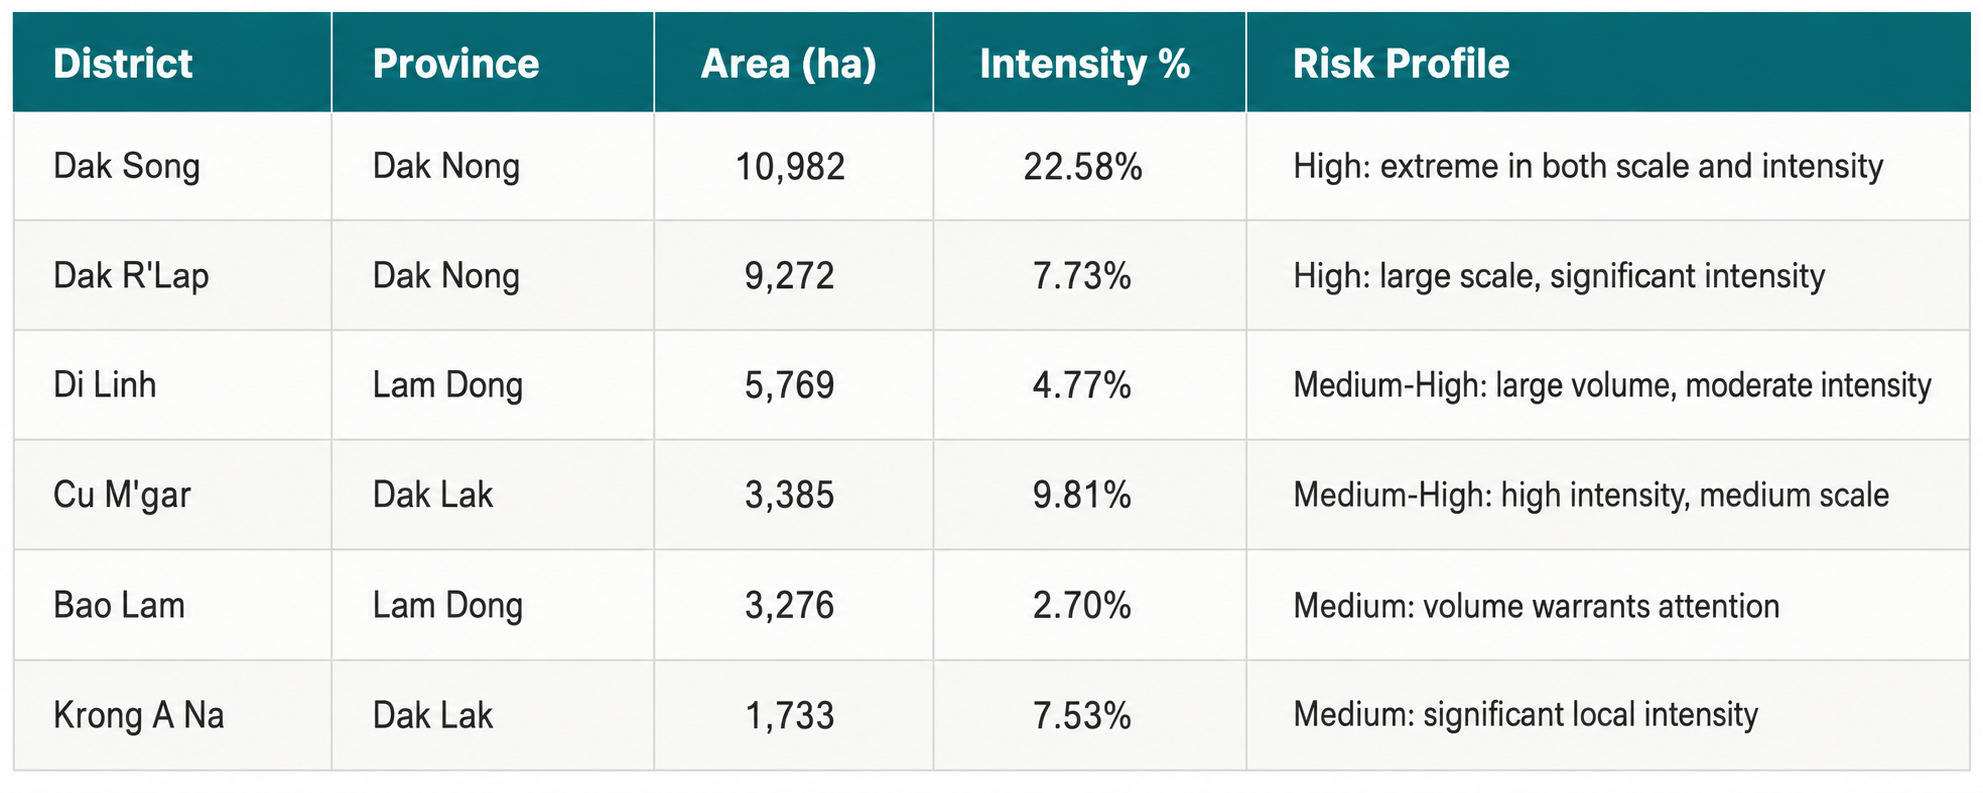
This assessment employs two dimensions that do not always align: conversion area (ha) as a measure of absolute risk scale, and percentage of forest replaced as a measure of relative intensity against the local forest base. Both must be read together to avoid oversimplification.
Table 3. Risk profile matrix for the six primary hotspot districts.
Dak Song is the only district that stands out in both dimensions: the highest area and the highest intensity. This makes it the unambiguous top-priority district, free from interpretive ambiguity. Dak R’Lap follows with a large scale despite more moderate intensity — which still places it firmly in the high-risk tier.
Cu M’gar is notable for its inverse pattern: smaller area than Di Linh, but local intensity (9.81%) is substantially higher. This means that within the district’s context, conversion pressure on local forest is deeply felt. A similar situation exists in Krong A Na (7.53%) — an intensity that cannot be overlooked despite a smaller absolute volume.
Figure 3. District hotspot map based on indicated forest-to-coffee conversion with intensity gradation
Risk Profiles of the Three Provinces
Once district figures are read, the assessment builds distinct risk profiles for each province. These profiles are not merely statistical summaries — they are the basis for proportional due diligence strategies.
Dak Nong is the risk epicentre of this assessment. With 21,121 ha of conversion (58% of total AOI) and a provincial intensity of 4.97%, Dak Nong already stands out at the aggregate level. But the most critical reading is at the sub-level: Dak Song and Dak R’Lap together account for more than 95% of all provincial conversion. Risk in Dak Nong is not evenly distributed — it is spatially concentrated. The due diligence implication is concrete: companies sourcing from Dak Nong must demonstrate that supply does not originate from these two districts — or, if it does, that the geolocation of specific plots does not intersect with historical conversion areas and that no tree cover loss occurred after the 2020 cut-off.
Lam Dong’s provincial percentage (1.33%) can easily be misread as a low-risk signal. The assessment shows that reading is misleading if it stops there. Lam Dong’s very large forest base (716,909 ha) dilutes the provincial percentage, but does not erase the fact that Di Linh (5,769 ha) and Bao Lam (3,276 ha) have recorded real conversion volumes. Di Linh is Vietnam’s most important arabica coffee production centre. Procurement volumes from this district tend to be large in many companies’ portfolios. The combination of substantial historical conversion and Di Linh’s strategic role in premium coffee supply chains makes it a verification priority that cannot be ignored on the strength of a low provincial percentage alone.
Dak Lak is Vietnam’s most famous coffee province — and that reputation can itself become a hidden risk under EUDR. A region’s reputation does not substitute for plot-level proof. The assessment shows that while Dak Lak’s total conversion is smaller (5,731 ha, 1.05%), Cu M’gar (9.81%) and Krong A Na (7.53%) have local intensities that are sufficiently strong. Buon Ma Thuot City, as the largest coffee collection hub, recorded 590 ha of conversion at 5.50% intensity — a figure relevant because of the very large supply volumes passing through and the higher potential for origin blending across districts.
From Assessment to Action: The Due Diligence Framework
The assessment produces signals — not final decisions. Its value lies in its capacity to transform complex data into concrete, proportional action priorities.
1. The Agriplot Due Diligence System
The Agriplot Due Diligence System is a purpose-built, web-based platform designed to meet the EUDR’s plot-level compliance demands. The platform integrates supply chain data, multi-temporal satellite imagery, and AI-powered geospatial analytics to generate the plot-level visibility required for due diligence. In the context of Vietnamese coffee, Agriplot functions as the bridge between farm geolocation data in the field and the forest loss database — enabling users to verify whether a given plot has a history of deforestation after the 31 December 2020 cut-off.
Research by Murti et al. (2026) demonstrates that dashboard-based systems of this kind — linking data from the product level down to the individual plot — represent critical infrastructure for meeting EUDR requirements while also advancing regenerative agricultural practices more broadly.
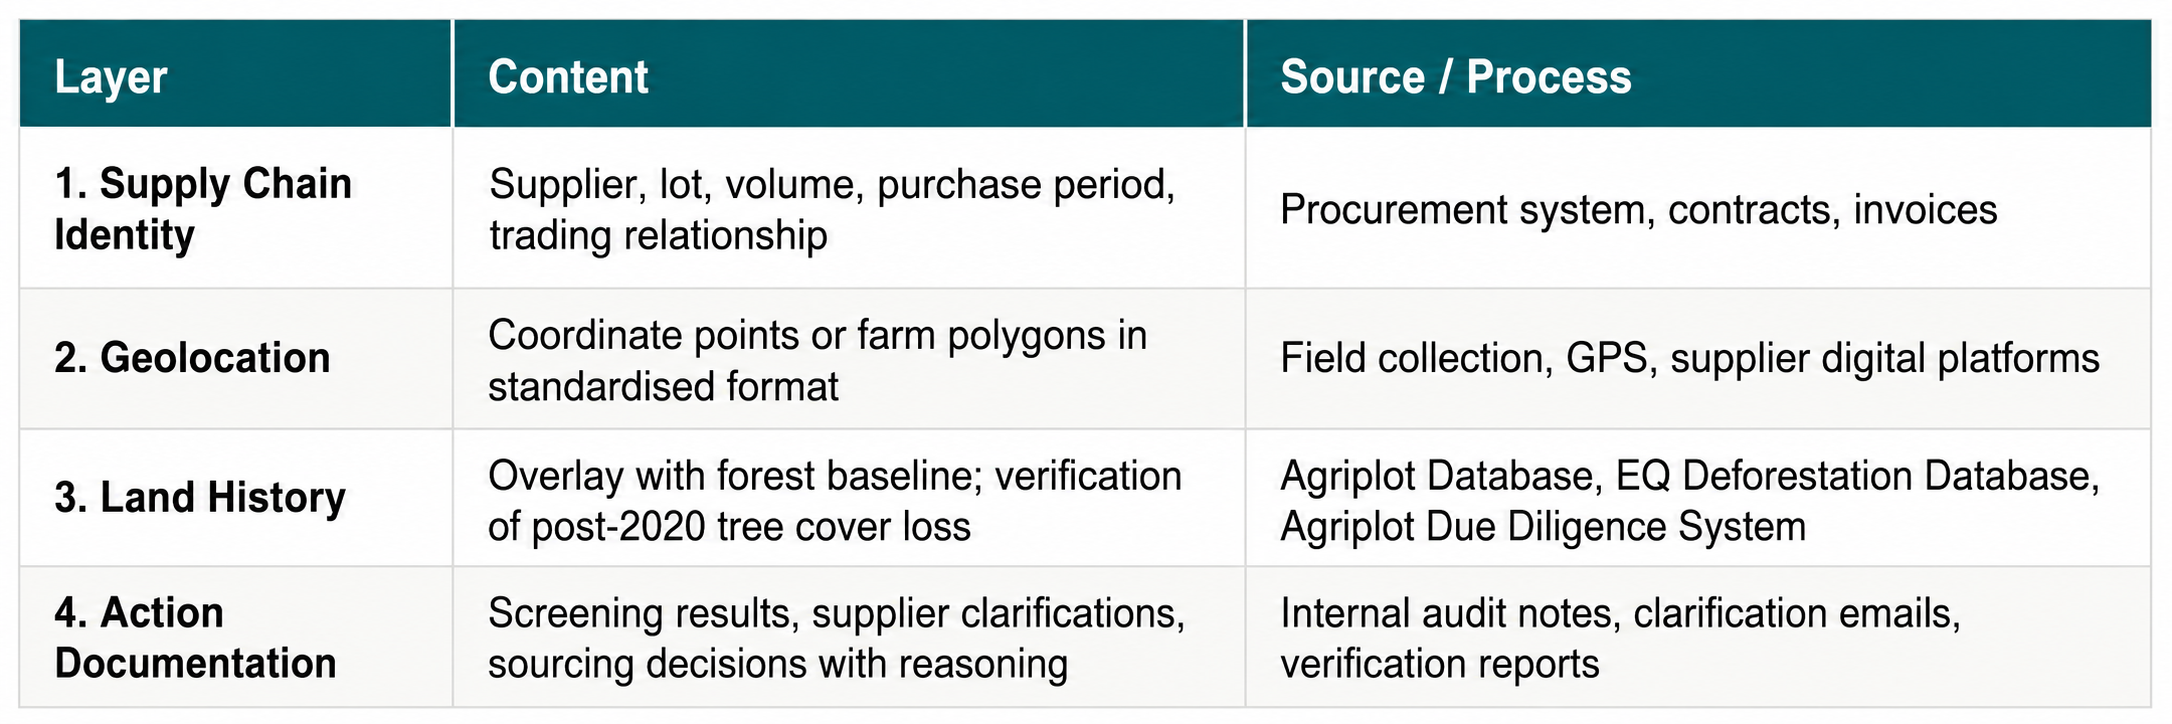
An audit-ready evidence pack for coffee under EUDR requires four interconnected layers:
Table 4. Four evidence-pack layers for EUDR coffee due diligence.
This assessment contributes most directly to the third layer: signalling where land history needs to be examined more intensively. It does not replace plot verification, but determines where that verification should be prioritised.
2. Legal Production: Land Legality as an Evidence Requirement
EUDR is often discussed as a deforestation-free regulation, but the compliance test is broader. The commodity also has to be produced in accordance with the relevant legislation of the country of production. For coffee, this makes legality a separate evidence question: a plot may pass a forest-loss overlay, while still requiring confirmation that production is legally grounded under applicable land-use, tenure, environmental, labour, tax, or other national requirements.
In practice, legality evidence should be connected to the same origin record used for geolocation and land-history screening. A supplier file should therefore link the farm or farmer group to a declared plot, the available farmer or cooperative registration record, land-use or supplier declaration, and any clarification needed for disputed or incomplete cases. The purpose is not to overburden smallholders with paperwork, but to make the evidence pack internally consistent and auditable.
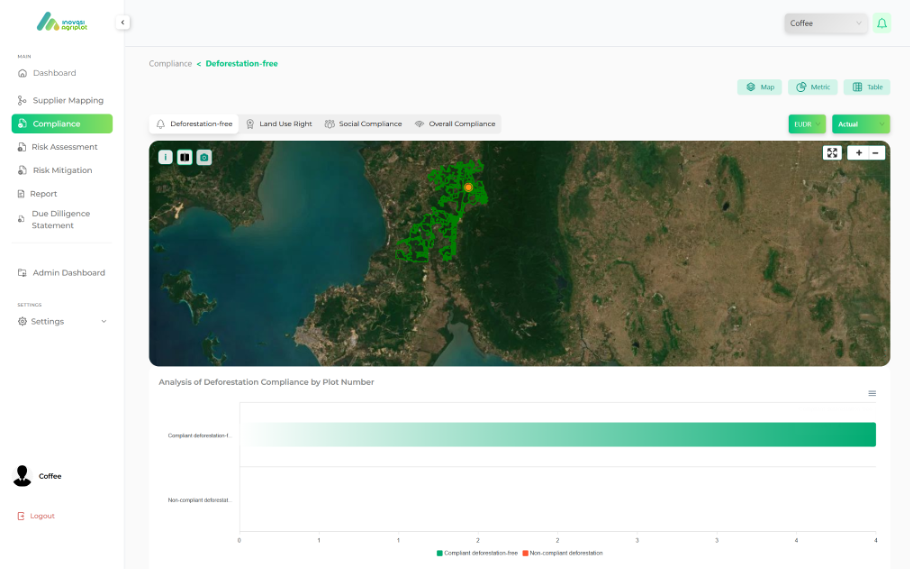
3. Inside the Agriplot Dashboard
The Agriplot dashboard is a visual interface designed to translate complex geospatial data into operationally actionable information. The main view displays several functionally integrated components:
Figure 4. The Agriplot Due Diligence System dashboard
In the Vietnamese coffee context, the integration of district-level results from this assessment with a platform like Agriplot creates a two-layer system that reinforces itself: spatial analysis at the district level provides a macro risk map for procurement prioritisation, while Agriplot supplies the micro verification infrastructure to demonstrate that specific plots do not intersect with historical conversion areas and are free of tree cover loss after the 2020 cut-off.
Coffee Supply Chain and Export Flow Context
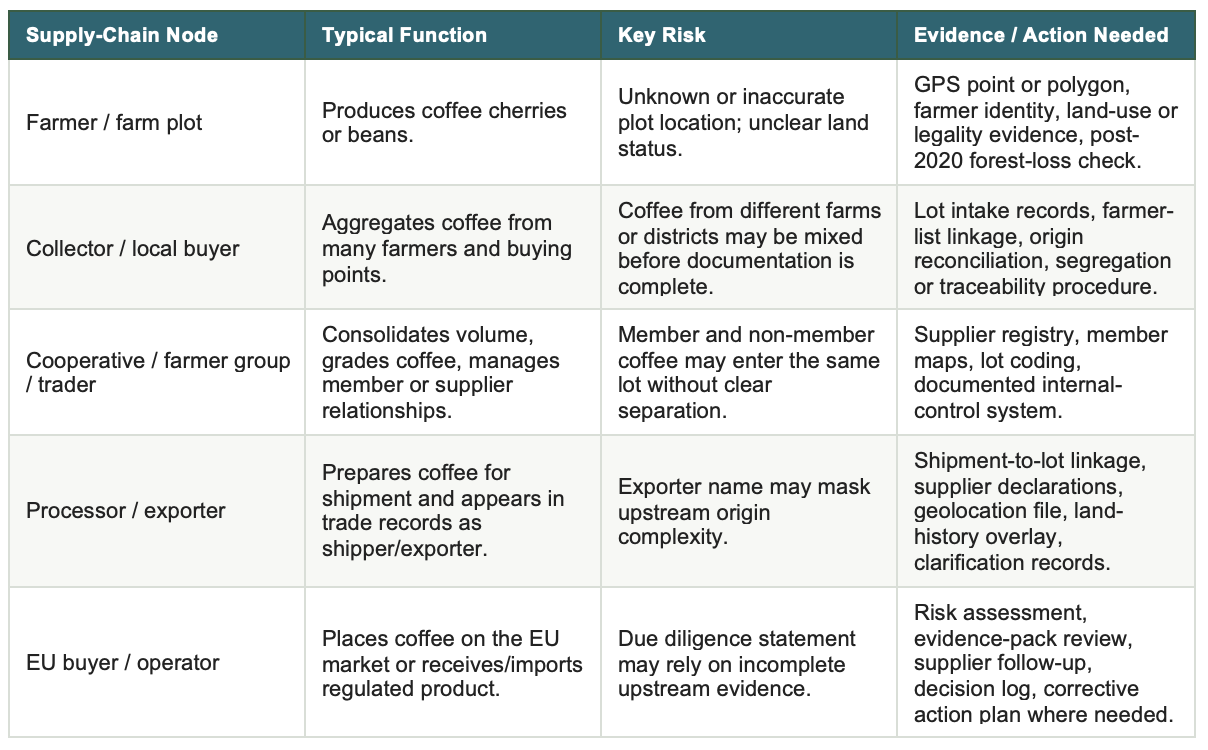
The spatial assessment becomes easier to use when it is read alongside the way coffee moves commercially. In practice, origin is not created by one export record. It is built through a chain of farms, buying points, collectors, cooperatives, processors, exporters, and buyers. This is why shipment-level data is useful for understanding market exposure, but cannot replace farm-level traceability.
For EUDR, the operational question is therefore twofold. First, can a commercial lot be traced back to the farmers and land parcels that produced it? Second, can the same origin record support deforestation screening, legality checks, and supplier follow-up when risk is detected?
1. From Farmers to Exporters
A typical coffee flow begins with farmers producing cherries or dried beans. Collectors and local buyers then consolidate small volumes from many farms. Cooperatives, traders, or processors may sort, dry, grade, store, and prepare coffee for a specification. Exporters arrange the formal shipment, while overseas buyers, roasters, or operators receive the product and make regulatory decisions.
Each hand-off changes the evidence problem. At the farm level, the core questions are plot identity, land history, and legal production. At collection level, the question becomes whether coffee from different farms or villages has been mixed before documentation is complete. At exporter level, the question becomes whether the shipment can be reconciled back to the intake lots and farmer lists behind it.
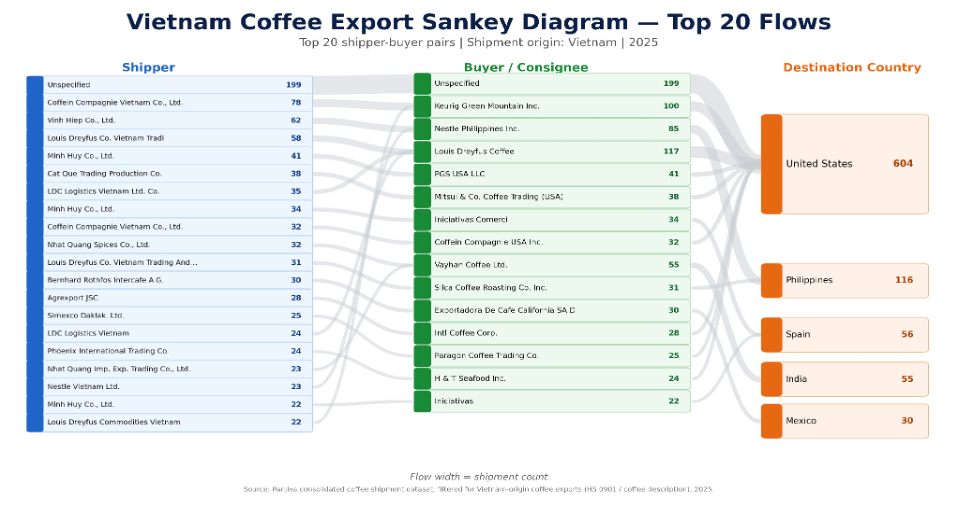
Industry examples show why this distinction matters. The Global Coffee Platform describes Simexco Daklak as a leading Vietnamese coffee exporter with a farm-gate purchasing network, training and quality-control activities in growing areas, and annual green-coffee purchasing and export capacity of more than 100,000 tonnes (Global Coffee Platform, 2023). Vietnam Agriculture Newspaper also reports that enterprises and cooperatives in Lam Dong and Dak Lak are building raw material areas through farmer linkages, including company relationships with thousands of households and cooperative sales to exporters such as Simexco Daklak and Dakman (Vietnam Agriculture Newspaper, 2023).
The implication is direct: an exporter name is useful, but it is not enough. Compliance evidence has to follow the coffee upstream, especially where a shipment is assembled from many small farms, multiple collectors, or several villages within one commercial lot.
2. Export Flow as a Trade Lens
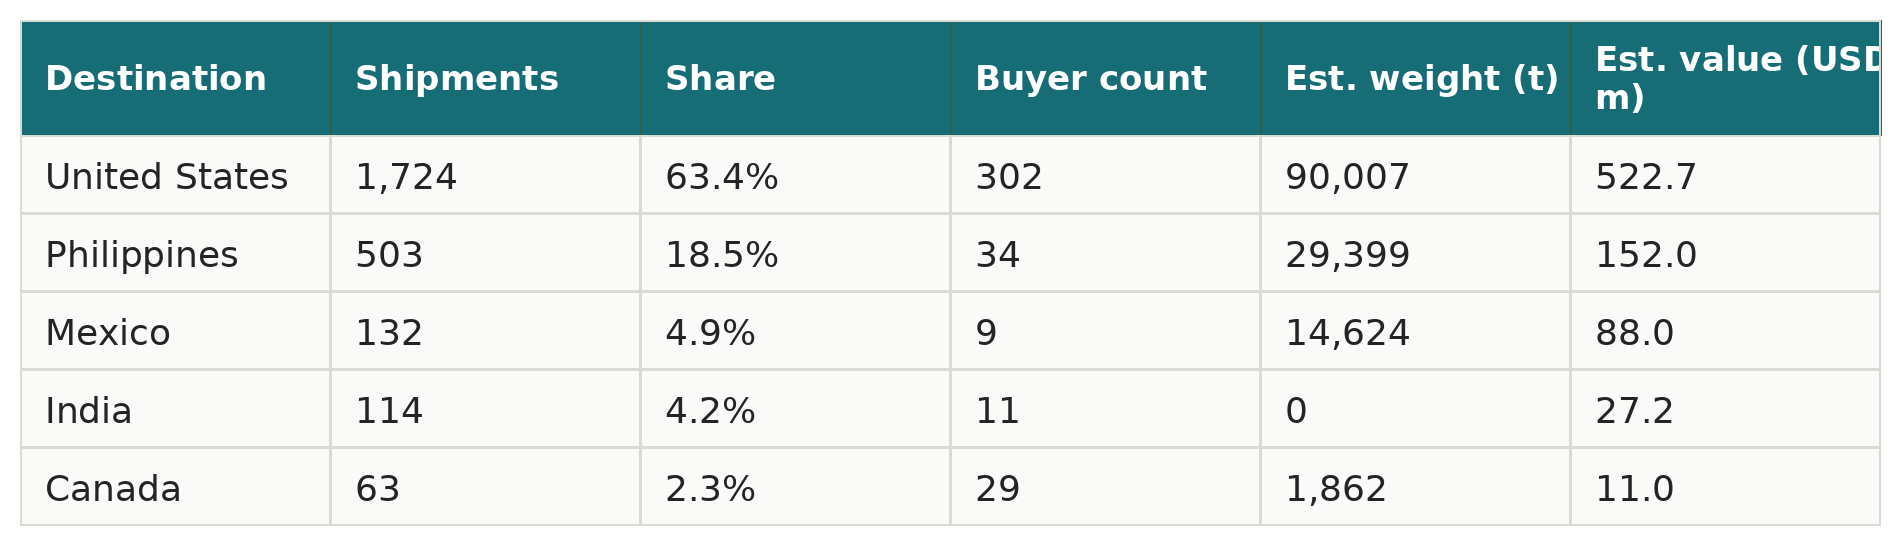
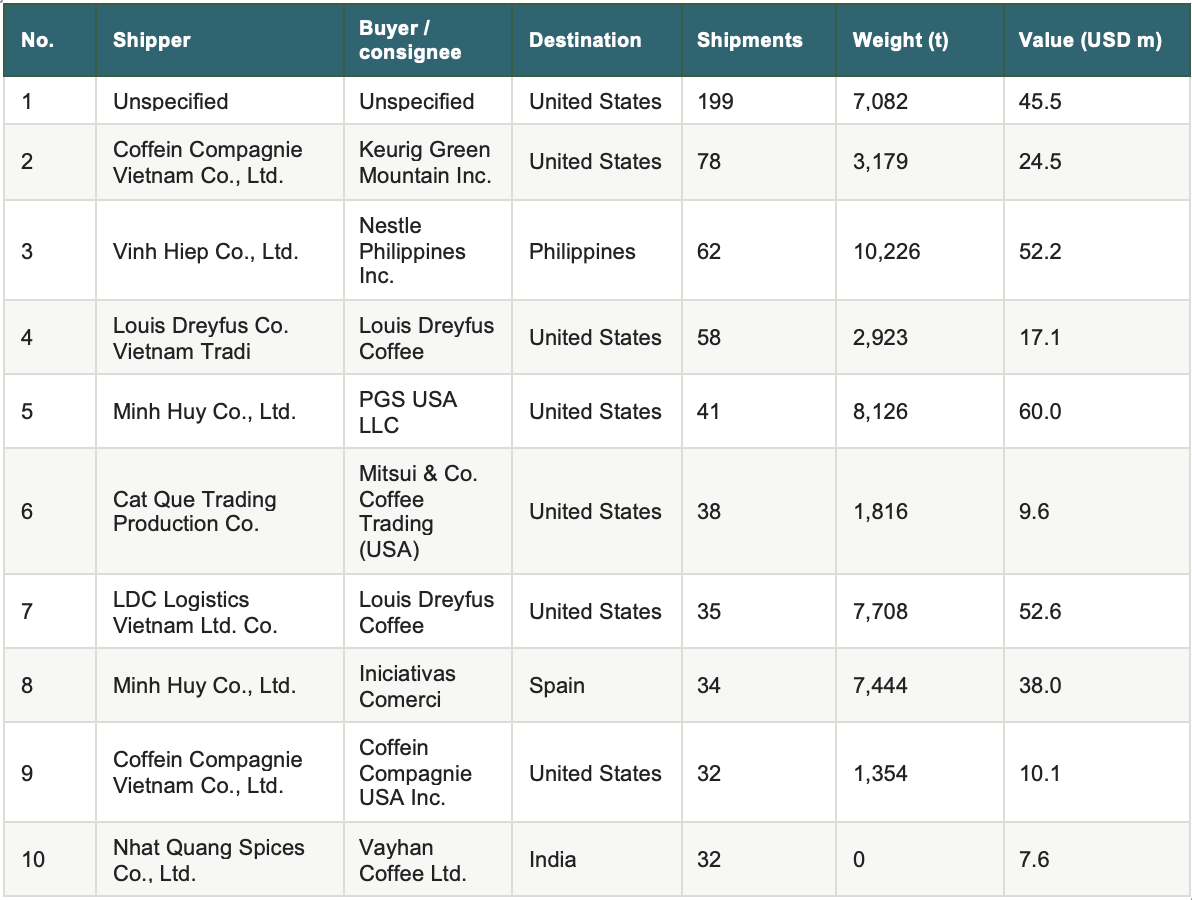
The Sankey diagram below complements the spatial assessment by showing the main commercial routes in the filtered Vietnam-origin coffee export dataset. It helps identify major shipper-buyer relationships and destination markets. It should not be read as proof of plot-level compliance, because trade-flow data does not show whether each shipment is linked to farm geolocation, segregated lots, or land-history checks.
Table 5. Main destination markets for Vietnam-origin coffee exports in the filtered dataset.
Table 6. Selected top shipper-buyer flows used to support the Sankey interpretation.
3. Blending Risk and Lot-Level Traceability
The most material traceability risk in coffee is often not the exporter name itself. It is the possibility that coffee from many farms, villages, or districts is combined into one commercial lot before the evidence is complete. A shipment can have a clear shipper and consignee while still containing coffee from multiple production areas with different land histories.
Under EUDR, that matters because a deforestation-free conclusion must be supported by a traceable link between the shipment, the commercial lot, the supplier intake records, and the relevant farm geolocations. If the lot cannot be reconciled back to its contributing farms, then the shipment has an evidence gap even if the exporter is known and the destination market is clear.
For hotspot districts identified in this assessment, companies should test whether lots were segregated, whether purchase records can be reconciled with farmer lists, whether weight balances are plausible, and whether the declared origin matches the physical flow of coffee. Where traceability is incomplete, the gap should be documented as a data-improvement issue and handled through a time-bound corrective action plan, not treated as affirmative evidence of compliance.
Supplier Engagement and Risk Response
The purpose of the assessment is to guide better engagement, not to label whole areas as unacceptable. A high-risk district is a signal that verification should be deeper and documentation should be stronger. It is not, by itself, evidence that every supplier or farmer in that district is non-compliant.
This distinction is important for smallholder-inclusive sourcing. If companies react to risk maps by excluding entire sourcing areas, compliant farmers inside those areas may be unfairly removed from the supply chain. A more proportionate response is to use risk tiers to prioritise data correction, supplier clarification, and targeted verification.
1. High-Risk Areas Are Not Automatic Non-Compliance
Suppliers in higher-risk areas should be asked for stronger geolocation evidence, clearer lot documentation, and written clarification where a plot intersects with historical conversion or recent tree-cover loss. Where the issue is data quality, the response should focus on correction and verification. Where the issue is confirmed post-cut-off deforestation or an unresolved legality concern, the sourcing decision should be escalated and documented.
This approach keeps the burden proportionate. It also creates a practical pathway for improvement: first map the supplier base, then reconcile lots, then test land history and legality, and finally record the sourcing decision with the reasoning behind it.
2. Control Points for Action
Table 7. Supply-chain control points and due diligence focus for EUDR coffee.
The control points show why EUDR evidence should be designed as a chain, not as a single document. The same shipment may require farmer geolocation, lot reconciliation, land-history overlay, legality review, and a supplier engagement record before it can support a defensible due diligence conclusion.
Operational Implications for Value Chain Actors
Each actor in the value chain reads the assessment results from a different position. This section translates the assessment findings into role-specific implications.
1. Operators and Exporters
Operators are closest to upstream data. The primary challenge: geolocation quality from farmers — imprecise coordinates, overlapping polygons, or unclear farm boundaries. Assessment-based recommendations:
Prioritise geolocation data improvement programmes in Dak Song, Dak R’Lap, Di Linh, and Cu M’gar first.
Ensure supply segregation systems distinguish lots with verified geolocation from those without.
Build automated overlay processes between supplier coordinates and historical conversion layers as a standard part of lot intake.
2. Traders
Traders require sharp risk segmentation because they manage large volumes from many sources. Assessment implications:
Group suppliers by origin district and risk tier — not merely by country or province.
Apply differentiated evidence requirements: suppliers from High-risk districts require polygons and land history; Low-risk districts can be handled with coordinate points and standard documentation.
Integrate district summaries from this assessment into supplier scorecard systems.
3. Roasters and Brands
Roasters and brands bear the weight of expectations from consumers, regulators, and auditors. Assessment implications:
Deforestation-free claims must be systematically explainable: where the coffee originates, how its land history was checked, and how sourcing decisions were documented.
This assessment can serve as the basis for a credible sustainability narrative — demonstrating that risk is read spatially, not merely claimed in general terms.
For public communication, use precise language: ‘We conduct risk-based due diligence using spatial analysis’, rather than absolute claims that are difficult to substantiate.
Conclusion
The forest-to-coffee conversion assessment for Dak Nong, Lam Dong, and Dak Lak produces a clear picture: coffee-related deforestation risk in Vietnam’s Central Highlands is not uniformly distributed. It is concentrated in specific districts — particularly Dak Song and Dak R’Lap in Dak Nong, Di Linh in Lam Dong, and Cu M’gar in Dak Lak.
The total 36,371 ha of forest-to-coffee conversion identified over the period 2001–2024 should not be read as an indictment of the Vietnamese coffee industry. It is a risk map that helps supply chain actors ask more precise questions: from which district does this coffee originate, what is its land history, and is the available evidence sufficient to meet EUDR due diligence standards.
The primary value of this assessment lies not in the map itself — but in the way the map compels more precise questions, drives more structured documentation, and directs verification resources to locations that need them most. Over the long term, companies capable of reading risk spatially will be better positioned to substantiate deforestation-free claims — and better able to sustain equitable, responsible sourcing.
EUDR compliance for coffee cannot be resolved through a compelling origin narrative. It requires maps, data, and systems that connect the two into auditable evidence.
References
European Parliament and Council of the European Union. (2023). Regulation (EU) 2023/1115 on the making available on the Union market and the export from the Union of certain commodities and products associated with deforestation and forest degradation. Official Journal of the European Union.
European Commission. (2026). Regulation on Deforestation-free Products. Directorate-General for Environment. Retrieved May 2026 from https://environment.ec.europa.eu/topics/forests/deforestation/regulation-deforestation-free-products_en
European Commission. (2026). Frequently Asked Questions on the EU Deforestation Regulation, 5th iteration. Directorate-General for Environment.
Coffee Deforestation Risk Assessment (DRA), Dak Lak Province, Viet Nam. Technical report on methods, district analytics, and spatial deliverables (internal analytical document, 2025).
Spatial Forest-to-Coffee Conversion Analysis, Dak Nong, Lam Dong, and Dak Lak, Vietnam, 2001–2024. Provincial summaries, district summaries, AOI maps, indicative rasters (internal analytical document, 2025).
Hansen, M. C., Potapov, P. V., Moore, R., Hancher, M., Turubanova, S. A., Tyukavina, A., Thau, D., Stehman, S. V., Goetz, S. J., Loveland, T. R., Kommareddy, A., Egorov, A., Chini, L., Justice, C. O., & Townshend, J. R. G. (2013). High-resolution global maps of 21st-century forest cover change. Science, 342(6160), 850–853. https://doi.org/10.1126/science.1244693
Joint Research Centre (JRC), European Commission. (2023). JRC Global Surface Water Explorer and Forest Cover Monitoring datasets.
Global Human Settlement Layer (GHSL). (2023). GHS-BUILT and GHS-POP datasets. European Commission, Joint Research Centre. https://ghsl.jrc.ec.europa.eu
NASA Shuttle Radar Topography Mission (SRTM). (2000). SRTM 1 Arc-Second Global Elevation Data. U.S. Geological Survey. https://doi.org/10.5066/F7PR7TFT
Food and Agriculture Organization of the United Nations (FAO). (2015). FAO GAUL: Global Administrative Unit Layers. UN FAO.
FAO / Forest Data Partnership. Coffee Probability Layer and Regional Land Cover datasets (accessed 2024–2025).
General Statistics Office of Vietnam (GSO). (2023). Agricultural Statistics: Coffee Production Area and Output by Province.
Vietnam Ministry of Agriculture and Rural Development (MARD). (2023). Annual Forest Inventory and Reporting, Central Highlands Provinces.
Breiman, L. (2001). Random Forests. Machine Learning, 45(1), 5–32. https://doi.org/10.1023/A:1010933404324
Murti, S., Rahmawati, D. C., Pratama, M., Yazid, H., Ishak, Pamungkas, C., & Rafina, I. (2026). From product to plot: developing a visual dashboard to support beyond deforestation-free to regenerative supply chains. IOP Conference Series: Earth and Environmental Science, 1622, 012016. https://doi.org/10.1088/1755-1315/1622/1/012016
Global Coffee Platform. (2023). Meeting Members: Over a cup of coffee with SIMEXCO DAKLAK. https://www.globalcoffeeplatform.org/latest/2023/meeting-members-over-a-cup-of-coffee-with-simexco-dak-lak/
Vietnam Agriculture Newspaper. (2023). Robusta Coffee: Expanding raw material areas to meet orders. https://van.nongnghiepmoitruong.vn/expanding-raw-material-areas-to-meet-orders-d357765.html
Panjiva. (2025). Panjiva Consolidated Export Coffee 0901 shipment dataset. Shipment-level dataset used for supplementary trade-flow analysis.
Prefer to read it offline or share it with your team?
Download the PDF version of the full article below.
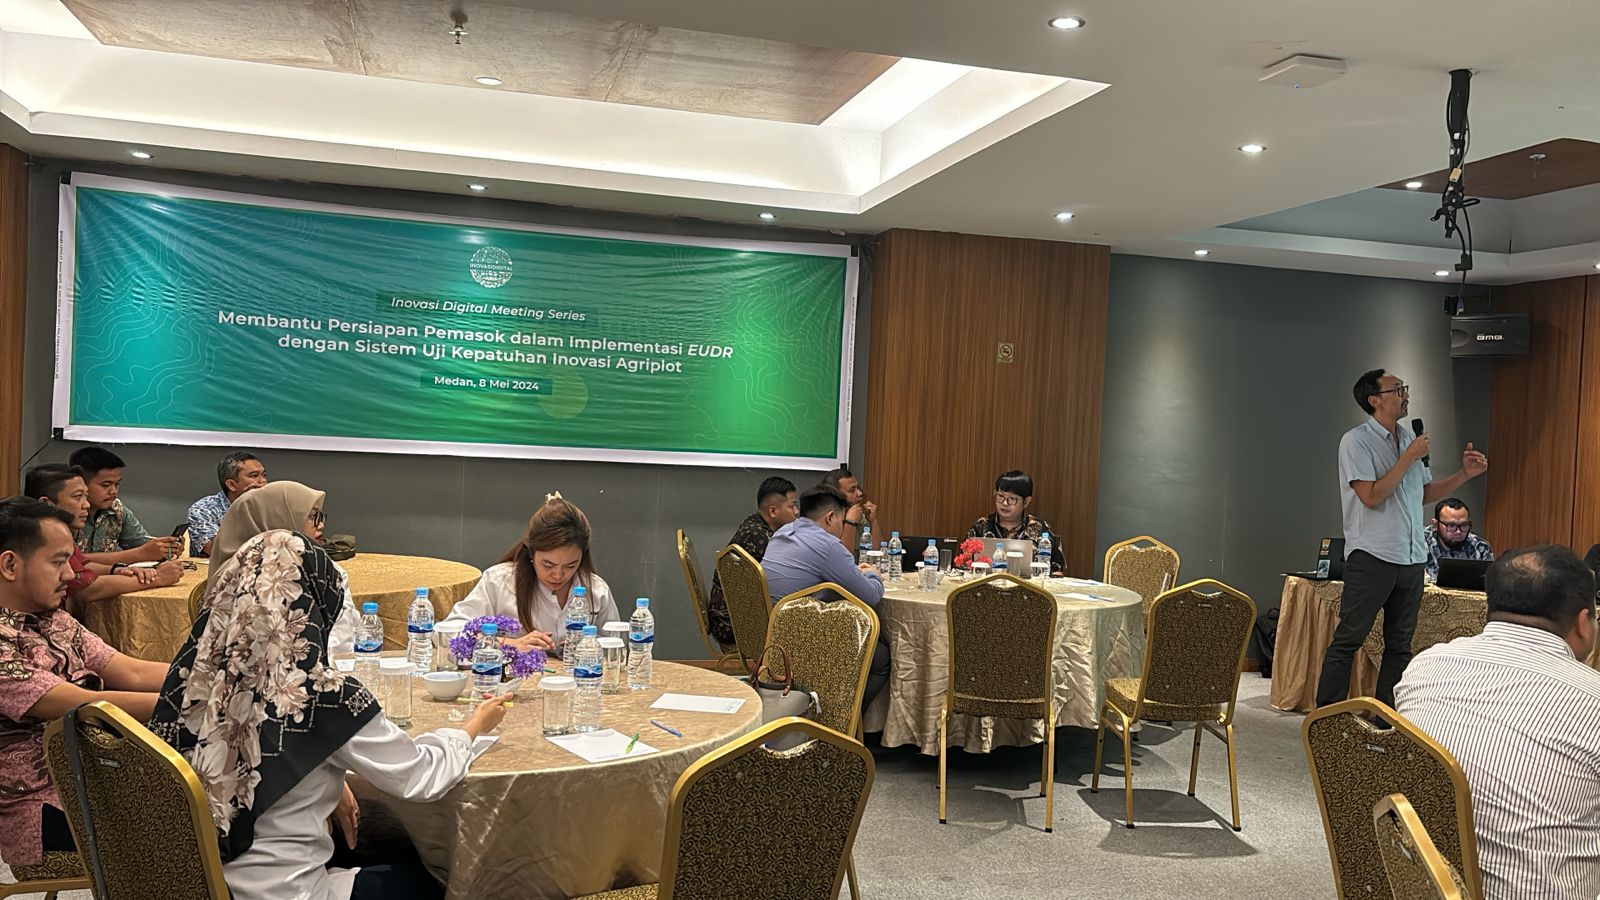
The EU Deforestation Regulation (EUDR) is changing how coffee and cocoa supply chains need to prepare for market access. For Indonesian businesses, the challenge is no longer only about understanding the regulation, but also about ensuring that the data, documentation, and traceability systems behind their supply chains are ready to support due diligence in practice.
Under EUDR, products entering the EU market must be deforestation-free, legally produced, and traceable to the plot or land level. In practice, this creates significant challenges for exporters, cooperatives, traders, and processors, particularly in smallholder-based supply chains.
This webinar was organized to provide a practical introduction to what EUDR means for Indonesian coffee and cocoa businesses, and to highlight the practical preparation that is now becoming necessary.
For those who missed the session, or for those who would like to revisit the discussion, we are pleased to share the webinar recording below.
Presented by: Ihwan Rafina, Founder and Director of MosaiX; Jeremy Nathaniel, Founder of Kopi Fabriek; Maria Benedikta, Sustainability Head of Barry Callebaut Indonesia; Caesar Argo, Thematic & Traceability Data Unit Manager of Inovasi Digital
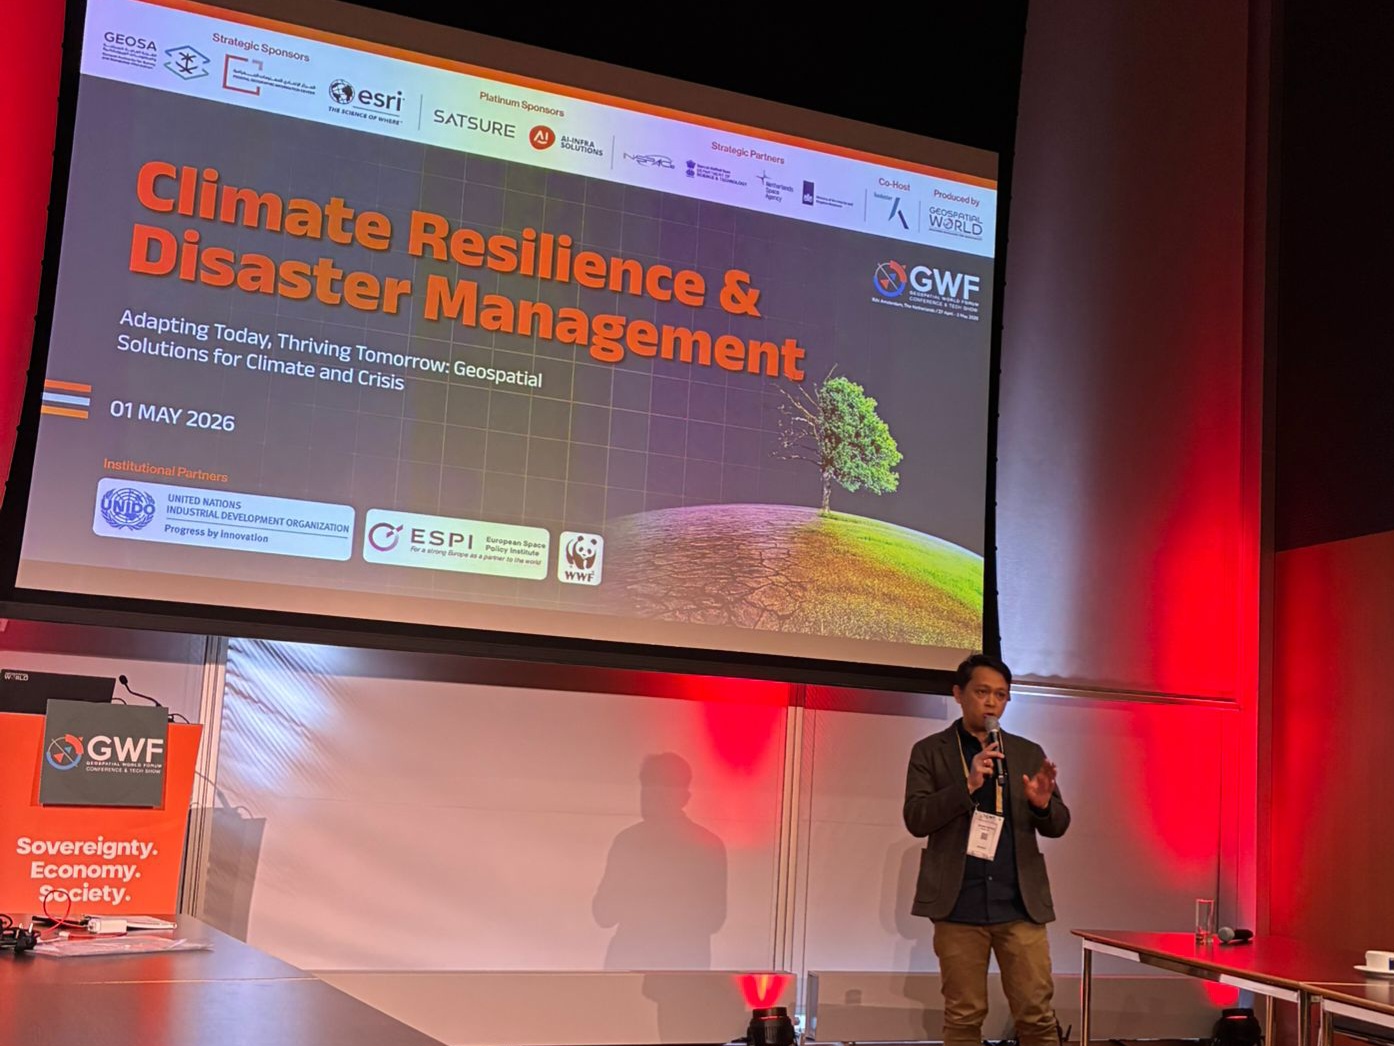
Amsterdam, The Netherlands — Last week, MosaiX joined the Geospatial World Forum 2026 in Amsterdam, where global leaders, technology innovators, policymakers, and geospatial practitioners gathered to discuss how geospatial intelligence can help the world respond to climate risks, disasters, and increasingly complex global supply chains.
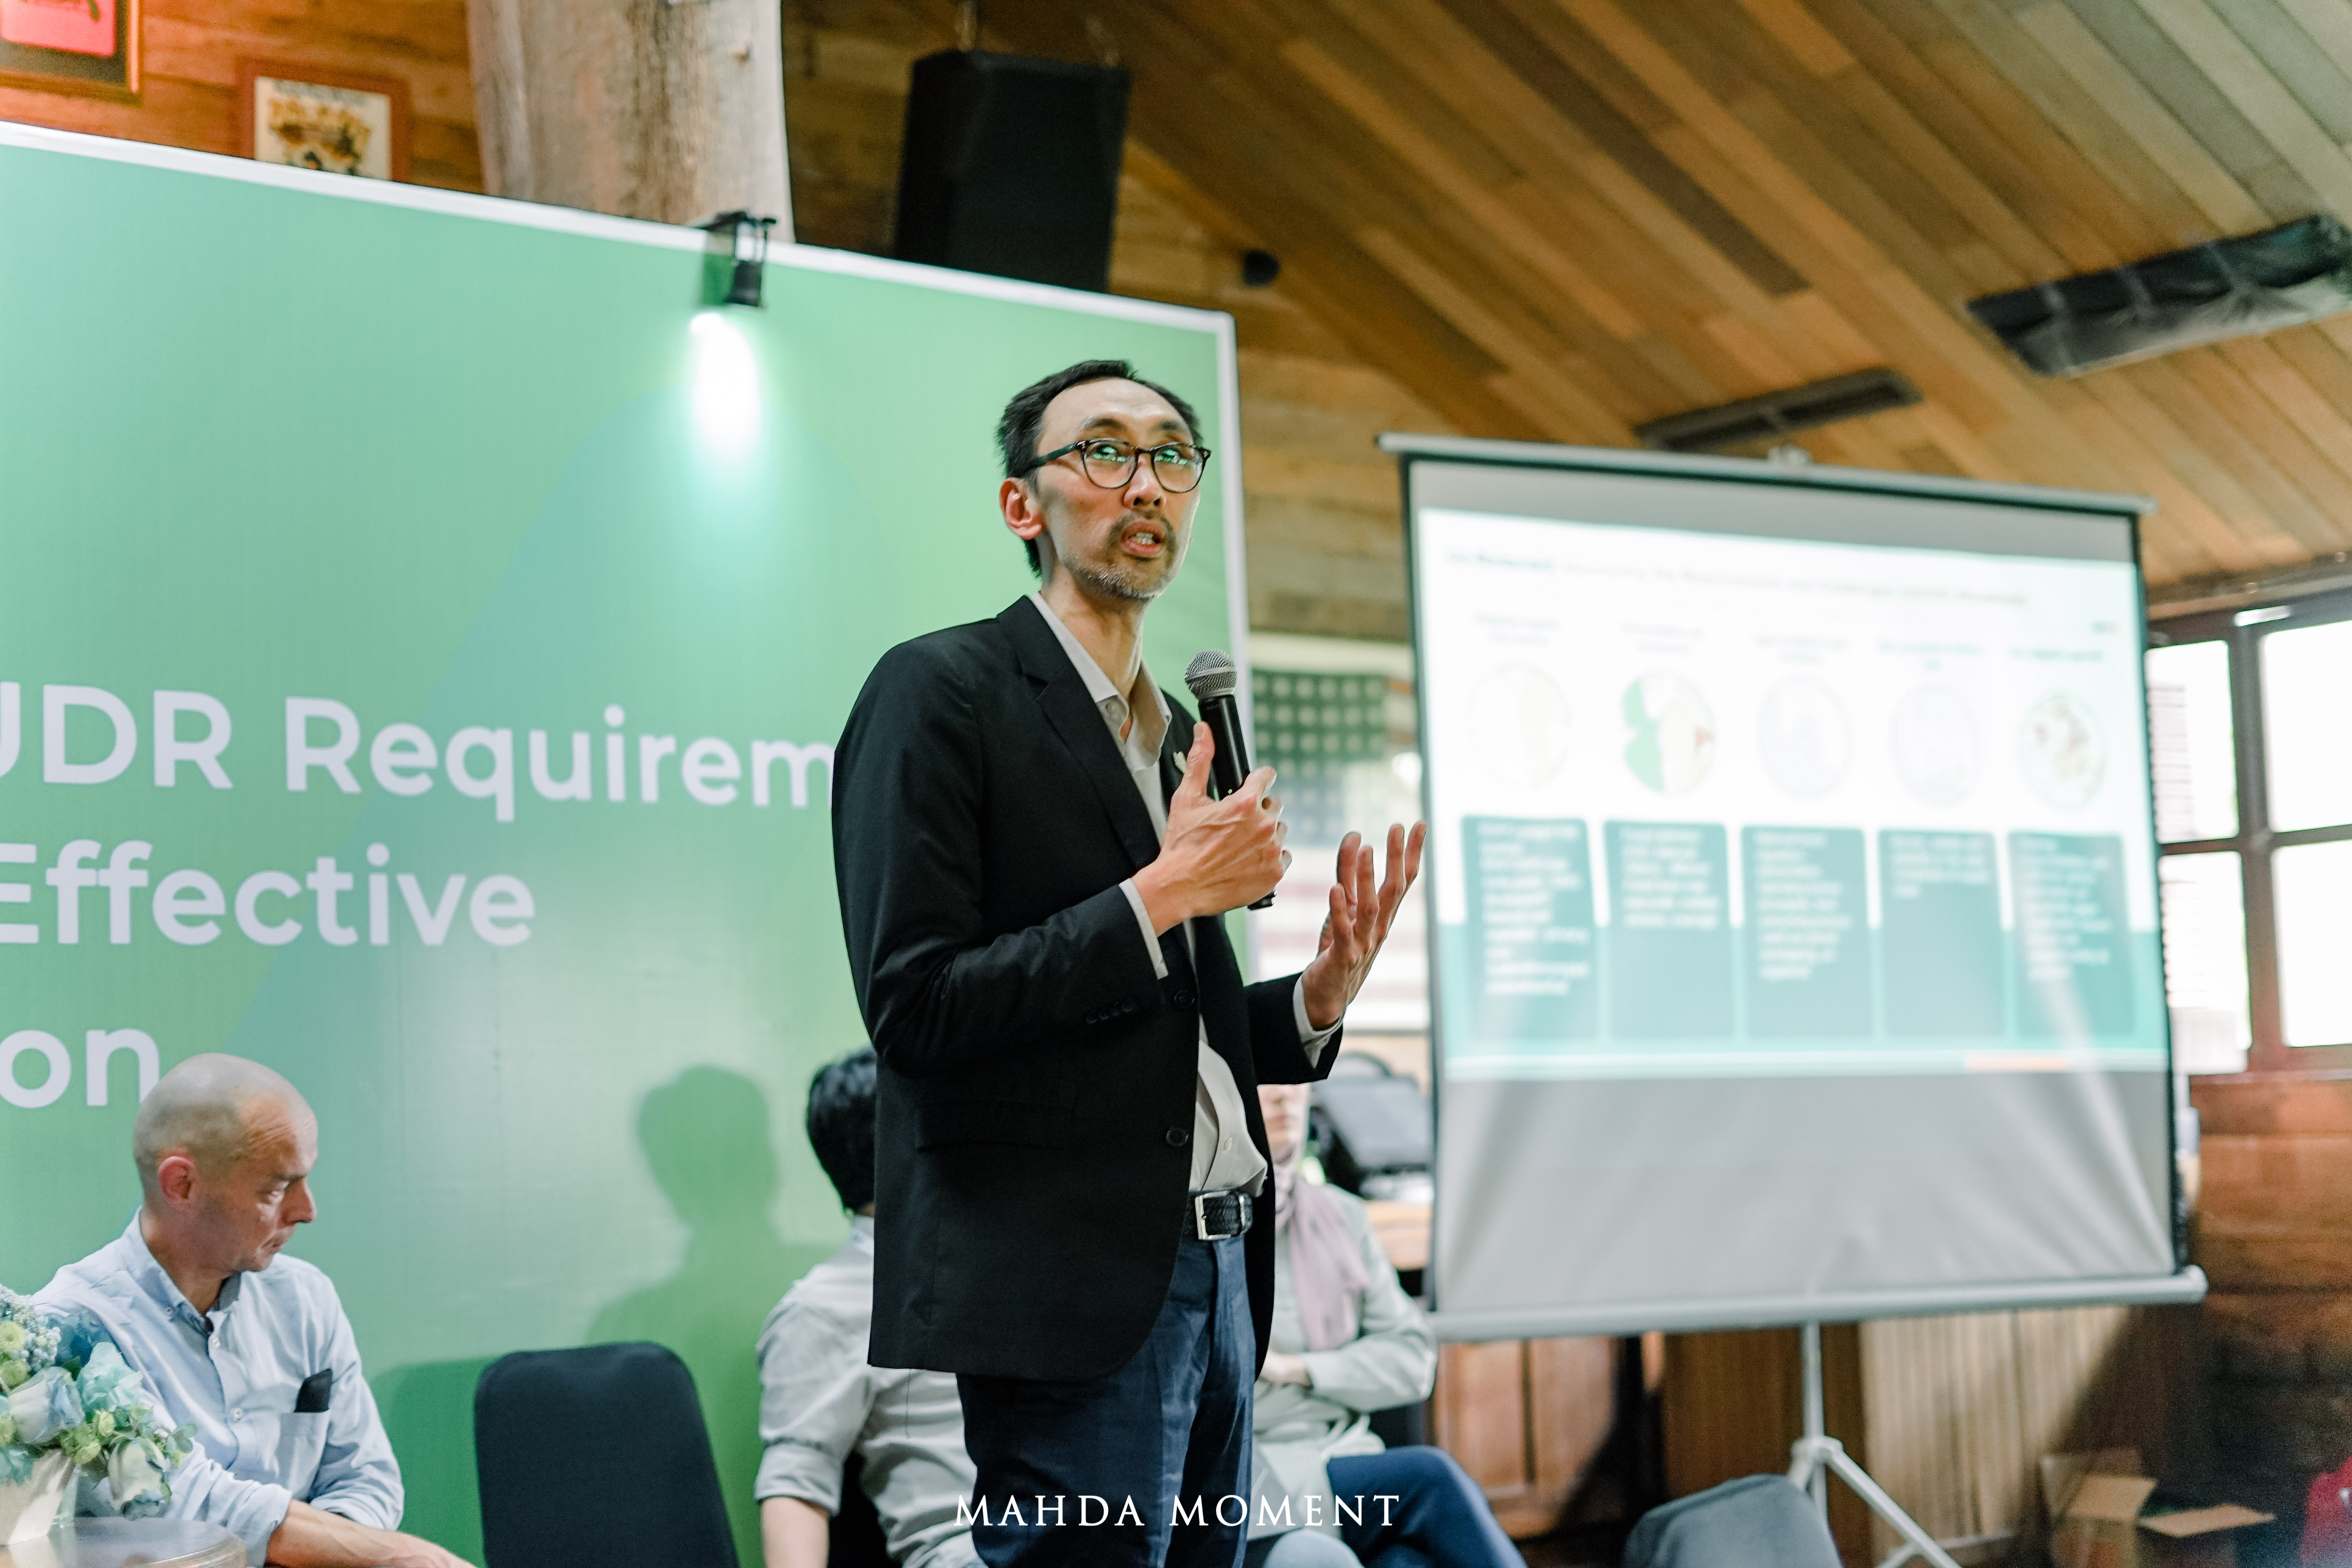
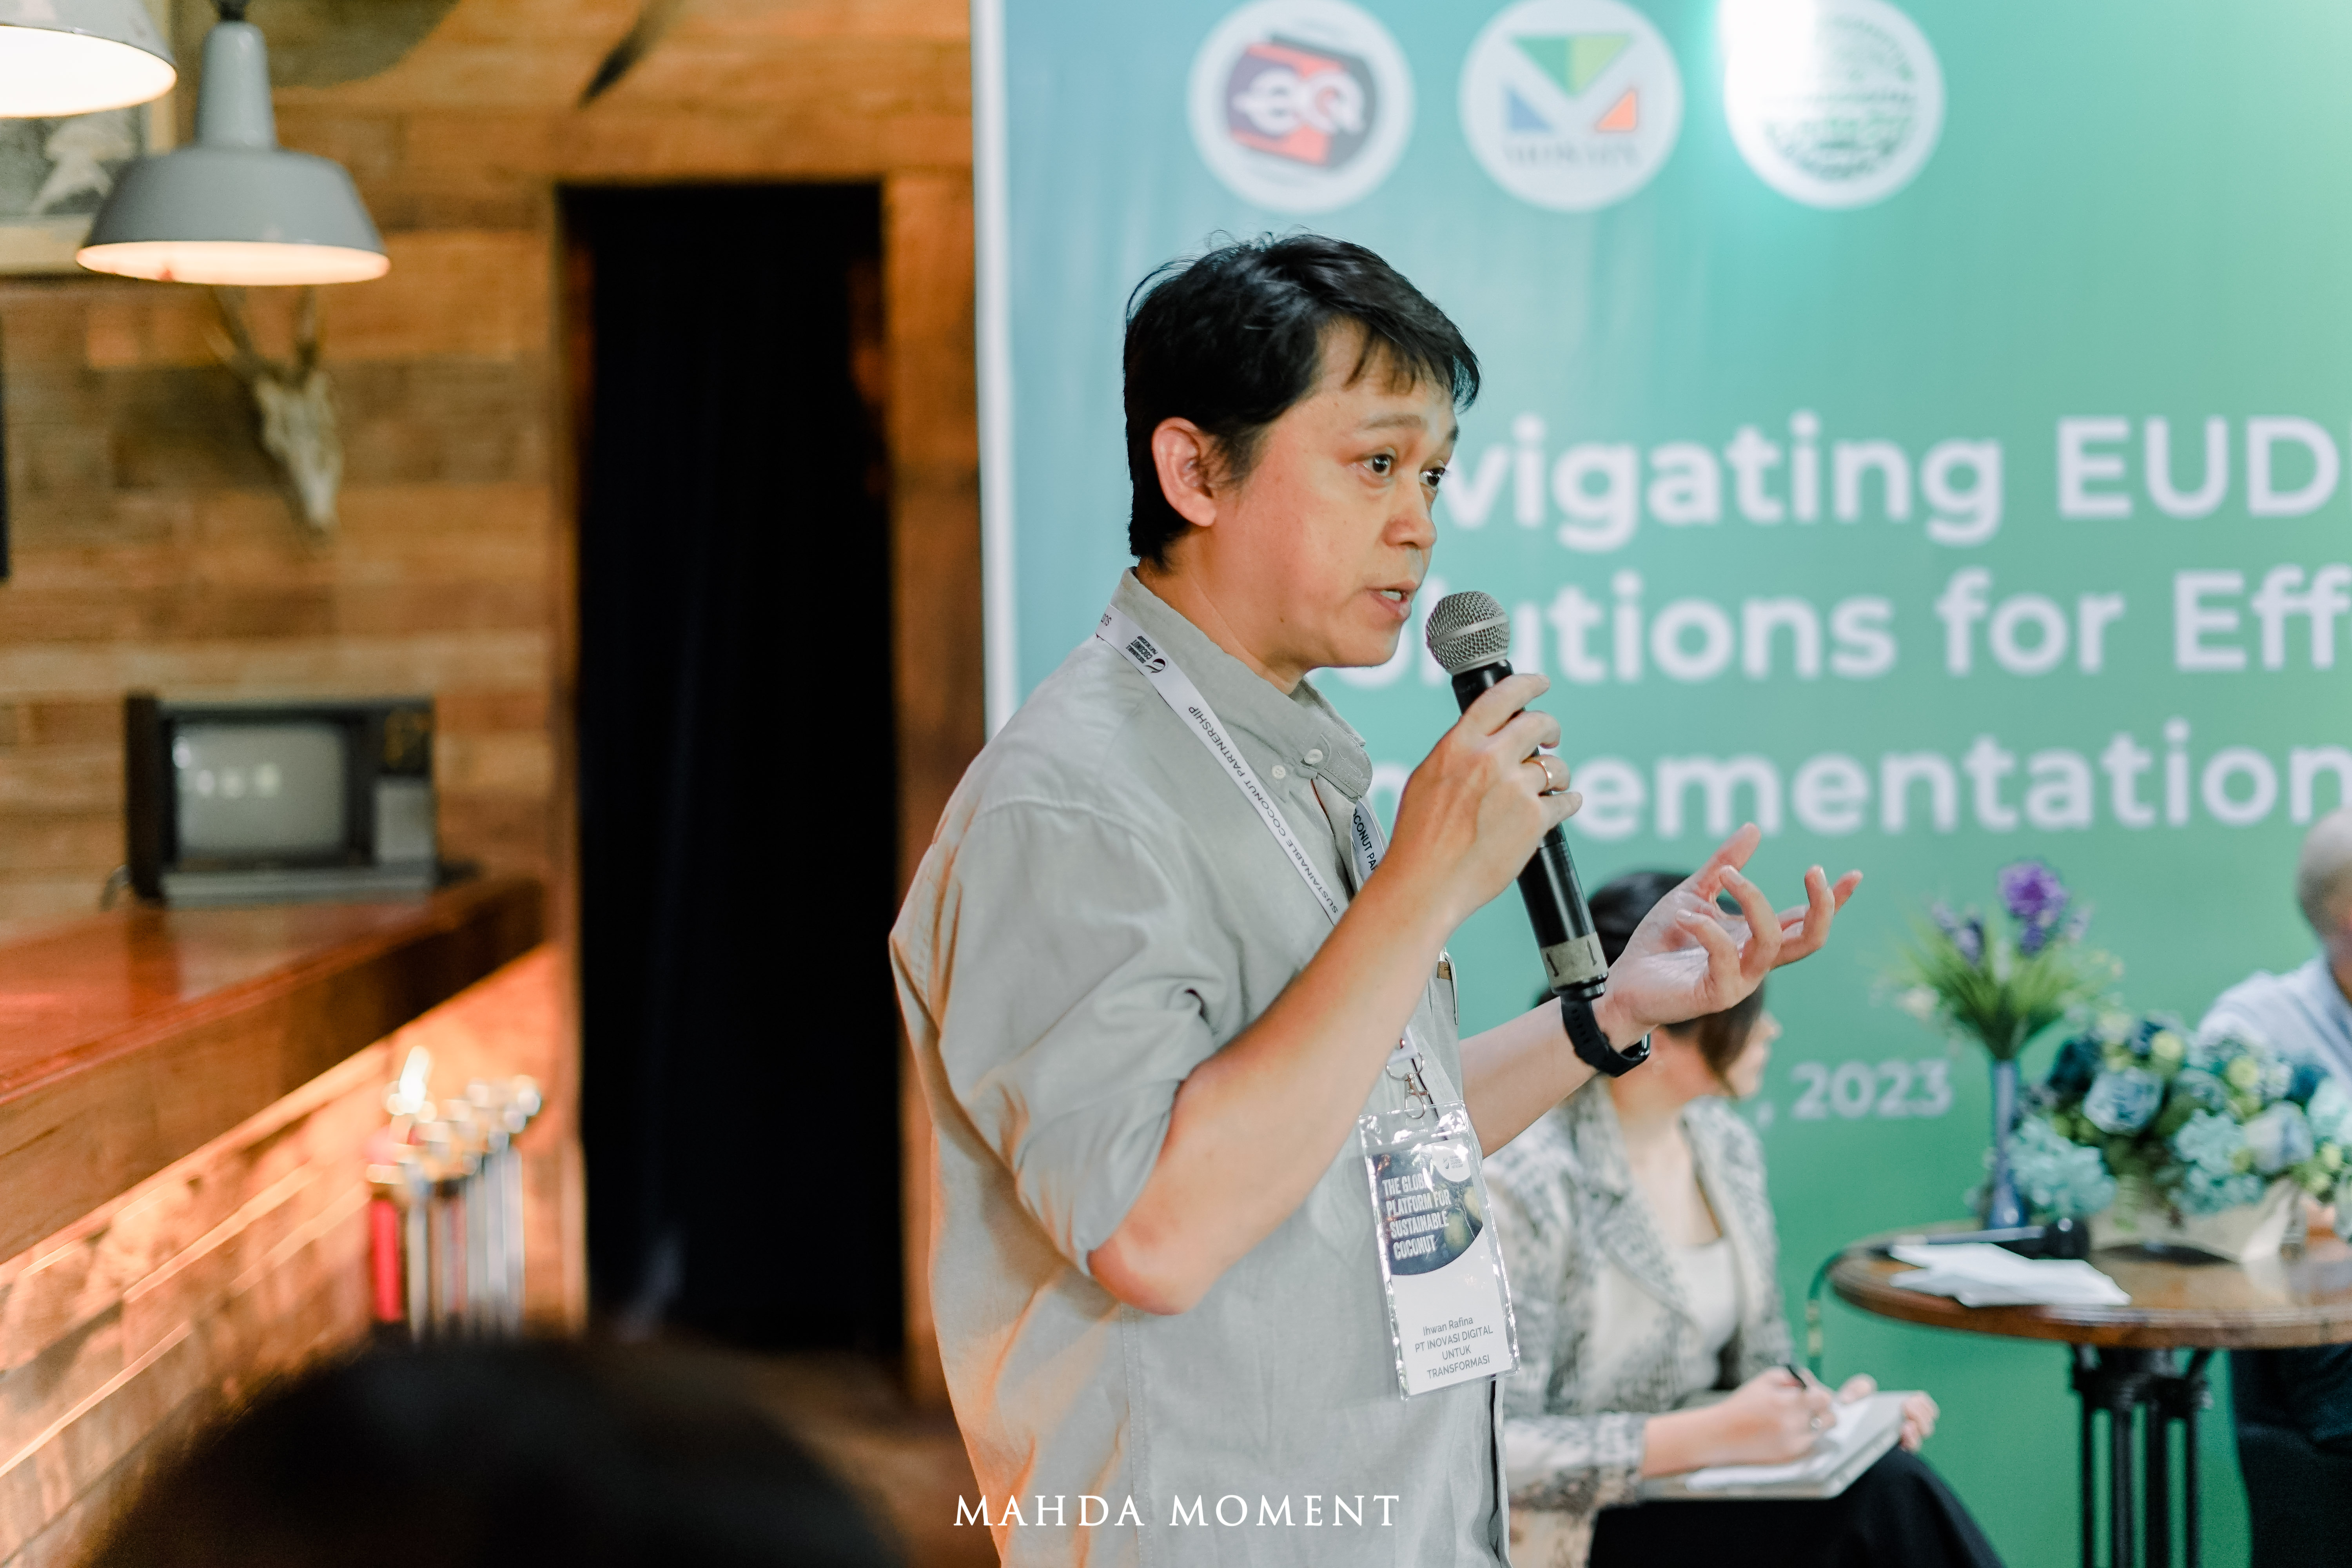
Representing MosaiX, Ihwan Rafina, Founder and Director, spoke during the session “Disaster Management in a Multi-Hazard World.” His presentation, “Beyond Compliance: Building a Trusted Geospatial Intelligence Backbone for Deforestation-Free and Hazard-Resilient Supply Chains,” focused on one of the most urgent questions facing sustainability and resilience systems today: how can rapidly evolving geospatial and AI technologies be translated into trusted action on the ground?
Across the world, the race to adopt artificial intelligence, satellite monitoring, remote sensing, and automated risk analytics is accelerating. These technologies are changing how companies detect deforestation, monitor agricultural landscapes, assess disaster risks, and respond to regulatory requirements such as the EU Deforestation Regulation. They allow risks to be seen faster, mapped more clearly, and analyzed at a scale that was not possible a decade ago.
But MosaiX emphasized that technology alone is not enough.
In many agricultural supply chains, the hardest challenge is not simply detecting forest loss from space. The real challenge is proving origin, confirming land legality, understanding tenure, validating supplier information, and ensuring that smallholders and local communities are not left behind. If companies rely only on satellite data or AI-generated analysis, there is a risk of producing conclusions that look precise, but may still be incomplete, biased, or disconnected from local realities.
This is especially important in commodities such as palm oil, cocoa, coffee, and soy, where supply chains are often fragmented and shaped by informal networks, intermediaries, unclear land records, and varying legal frameworks. A satellite image may show a land-use change, but it cannot fully explain who manages the land, whether the plot is legally recognized, whether community rights are involved, or whether the farmer has access to the systems needed to prove compliance.
During the presentation, MosaiX shared that the future of geospatial intelligence should not be framed only as a race for better algorithms. It should also be a race to build better collaboration, stronger field verification, more inclusive data systems, and practical mechanisms that help people act on the information produced.
This is where transformation happens: not only in dashboards, maps, or AI models, but on the ground, through intensive engagement with suppliers, smallholders, communities, governments, civil society, and companies across the value chain.
MosaiX’s work is supported by a wider ecosystem with Inovasi Digital and Earthqualizer Foundation. Inovasi Digital plays a key role in developing practical digital platforms and geospatial tools that help companies translate complex sustainability requirements into operational workflows. These systems support traceability, deforestation-risk screening, compliance monitoring, supplier engagement, and reporting. Earthqualizer Foundation contributes long-standing field experience in forest conservation, community engagement, ecosystem recovery, and commodity-driven landscape transformation.
Together, this ecosystem bridges the gap between technology and implementation. It combines satellite-based intelligence, digital platforms, regulatory understanding, and direct field experience to support supply chains that are not only compliant, but also more resilient, inclusive, and credible.
The message from MosaiX in Amsterdam was clear: geospatial and AI technologies are powerful, but they must be used responsibly. To avoid bias, false confidence, or exclusion, they need to be supported by ground-truthing, participatory mapping, local knowledge, transparent methodologies, and collaborative decision-making.
As climate risks intensify and regulatory pressure grows, industries will increasingly depend on trusted geospatial intelligence. But the success of these systems will depend not only on how fast technology evolves, but on how well it is connected to people, places, and real action.
For MosaiX, this is the next frontier of sustainability and disaster resilience: moving beyond compliance, beyond monitoring, and beyond technology alone, toward a trusted intelligence backbone that supports transformation where it matters most, on the ground.
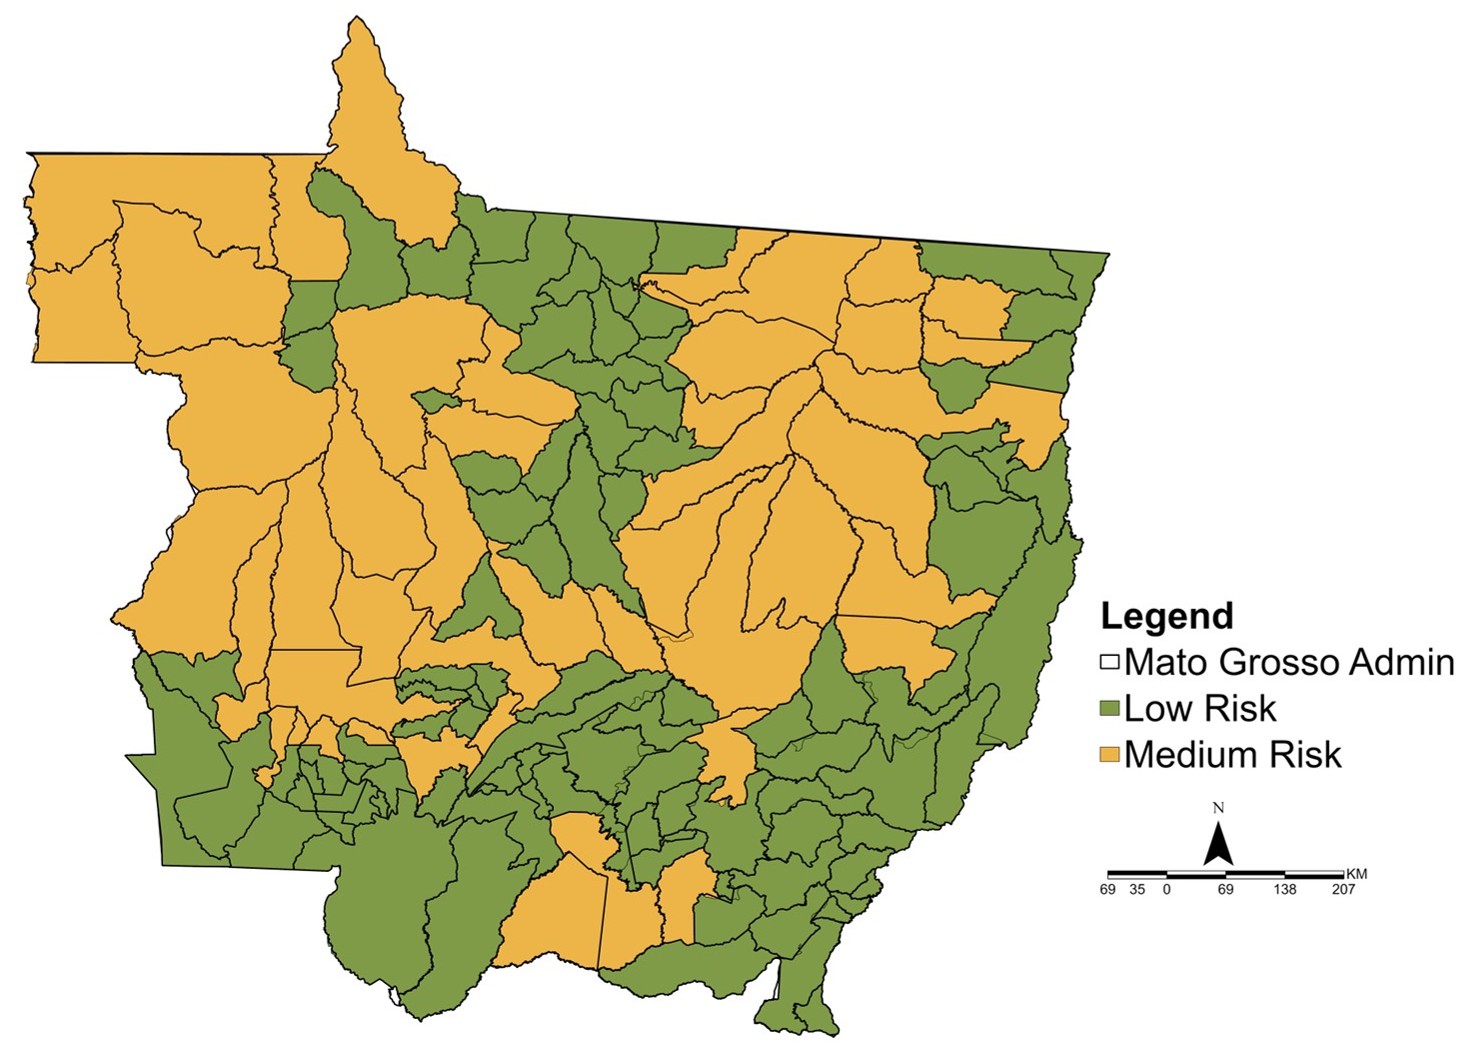
Mato Grosso is Brazil’s largest soy-producing state, responsible for roughly 27% of the country’s soybeans and about 30% of its soy exports – a critical piece of the global soy supply chain (Reuters, 2023). Soy cultivation in this region has long been associated with deforestation, making sustainability and legal compliance a central concern (WBCSD & Guidehouse, 2024).
The recently adopted EU Deforestation Regulation (EUDR) aims to curb global deforestation by prohibiting imports of commodities produced on land deforested after December 31, 2020, and by requiring compliance with relevant local laws. In practical terms, for Mato Grosso’s soy this means exports to the EU must be deforestation-free (post-2020) and legally produced under Brazilian law. The EUDR’s implementation timeline was even extended by 12 months to give stakeholders more time to comply (Council of the European Union, 2024), but soy exporters are already under pressure to meet these strict criteria.
In this case study, we assess Mato Grosso’s soy farms against EUDR criteria to evaluate the state’s readiness for compliance. Our analysis examines whether soy cultivation areas have avoided deforestation since 2020 and adhered to Brazilian legal requirements. We integrated multiple data sources to evaluate every major soy farm in the state for recent forest clearing and legal irregularities. This report presents the findings in an accessible way, highlighting how prepared Mato Grosso is for EUDR compliance and what challenges and opportunities lie ahead.
Methodology
Our assessment combined geospatial analysis with official data to determine which soy cultivation areas meet EUDR requirements. We gathered high-resolution data on soy planting locations and cross-referenced these with deforestation records, land registries, and protected area maps. Key datasets and tools used include:
Official land registry data: We used Brazil’s rural land cadastre systems (SIGEF) to obtain soy farm boundaries and ownership status, identifying which soy farms are officially registered versus those that are not. This helps flag any soy plots lacking proper registration or title, since unregistered farms often indicate legal irregularities (ABIOVE & APROSOJA, 2024).
Baseline forest cover (2020): A Global Forest Cover 2020 map (from the European Commission’s Joint Research Centre) served as a baseline for remaining forest as of the EUDR cutoff date (Köhl et al., 2023). This allowed us to know which areas were forested at end of 2020, so any subsequent clearing in those areas would violate EUDR’s no-deforestation rule.
Deforestation alerts (2021–2023): We monitored recent forest loss using integrated satellite-based deforestation alert systems, notably RADD and GLAD alerts (Landsat and Sentinel-2) for 2021–2023 (see Figure 1). These near-real-time alerts flag new clearing events across Mato Grosso’s landscapes, enabling us to detect any forest clearance that occurred after the cutoff date. Integrated alerts provide frequent updates and wide coverage to detect deforestation as it happens.
Tropical Moist Forest Deforestation Year: This dataset was developed by the European Commission’s Joint Research Centre (JRC). It provides the annual records of forest loss across Mato Grosso from 2013 to 2023. It was critical for assessing long-term deforestation trends and identifying the districts most affected by forest clearance. TMF deforestation year helps visualize deforestation changes over the decade, contextualizing recent developments in land use.
Inovasi Digital’s verified deforestation alerts: To improve accuracy, we leveraged Inovasi Digital’s Verified Deforestation Alerts (2021–2023). These are curated alerts that filter out false positives from the generic satellite alert systems and confirm genuine deforestation events. The Inovasi Digital’s- verified alerts offer superior accuracy compared to raw integrated alerts, ensuring we only count true forest loss in soy areas. This higher-quality alert data strengthens our monitoring of EUDR compliance by avoiding the noise of erroneous alerts (see Figure 1).
Soy planted area maps: We also used Inovasi Digital’s proprietary soy planted area maps to precisely locate soy cultivation plots across Mato Grosso. This dataset allowed us to focus the analysis on actual soy-producing areas rather than broad land parcels. Using Inovasi Digital’s soy map (as opposed to more general land cover data) ensured no soy farm was overlooked and that we didn’t misidentify non-soy land as soy. It greatly increased the accuracy of our compliance checks by zeroing in on the true soy footprint in the state.
Protected areas and public forests: We incorporated maps of protected areas, including Indigenous territories, conservation units, and Permanent Forest Reserves (public forests where agriculture is prohibited) from official sources (ICMBio, 2023) (see Figure 2). Any overlap between soy farms and these protected lands would indicate a legal violation. Identifying soy cultivation inside protected forests (so-called PRF overlaps) is crucial, since those areas would fail EUDR’s legality criterion regardless of deforestation timing.
Using these data layers, we evaluated every major soy plot in Mato Grosso against EUDR-like rules: (1) no forest clearing after 31 Dec 2020, (2) valid land tenure/registration, and (3) no farming inside protected forests. By cross-validating multiple sources (satellite alerts, official records, and Inovasi Digital’s refined data), our methodology minimized errors and provided a robust compliance status for each soy farm in the state.
Figure 1: Forest cover and deforestation alerts in Mato Grosso (2021–2023). The maps display remaining forested areas (green) and deforestation alerts (red) from both integrated alert systems (left) and ID-verified alerts (right). Extensive forest cover remains in the northern and western regions of the state. Deforestation activities are concentrated along forest edges and agricultural areas, with integrated alerts showing broader distribution and ID alerts providing refined, high-confidence detections. These visuals highlight key areas affected by land-use change and agricultural expansion.
Figure 2: Protected Areas and Conservation Units in Mato Grosso. The maps illustrate officially designated Protected Areas (left, yellow) and Federal Conservation Units (right, green) distributed across the state. These zones are legally restricted from agricultural activities, highlighting areas critical for assessing compliance with EUDR legality requirements. Data sourced from ICMBio (2023).
Results and Findings
Deforestation Trends
Our analysis of deforestation data (2013–2023) in Figure 3 shows that annual clearing in Mato Grosso spiked around the EUDR cutoff and then sharply declined. The state saw a peak in forest loss at nearly 500,000 hectares in 2020, one of the highest levels in the past decade (Köhl et al., 2023). Deforestation remained high into 2022 (around 500,000 ha that year as well), but by 2023 the annual clearing dropped to around 200,000 ha. This recent decline in deforestation may reflect stronger enforcement efforts and regulatory anticipation leading up to EUDR implementation. In short, Mato Grosso’s deforestation trend moved from a worrying surge to a significant reduction by 2023, which bodes well for future compliance if the trend holds.
Figure 3: Annual deforestation in Mato Grosso, 2013–2023. The bars show total area deforested each year (in thousands of hectares, “ha”). After moderate levels (~100–300 thousand ha) earlier in the decade, deforestation spiked to around 500,000 ha in 2022. A sharp decline is observed in 2023 (well under 200,000 ha), suggesting recent improvements in control measures.
Geographic Distribution of Deforestation
Deforestation linked to soy is not uniform across Mato Grosso. A small number of districts in the state’s northern and northwestern region account for a disproportionately large share of forest loss. For example, the districts of Colniza, Aripuanã, and Marcelândia each saw over 100,000 hectares of deforestation from 2013 to 2023, topping the list in forest clearing. Many of these top deforesting districts experienced notable spikes in particular years (such as Colniza in 2022, and Poconé with a large spike in 2020) as soy and other land uses expanded (see Figure 4). This means that enforcement and monitoring efforts may need to concentrate on a handful of hotspot regions, even though state-wide averages are improving. Overall, most other districts had much lower deforestation totals over the last decade, indicating the problem is concentrated rather than widespread.
Figure 4: Top 10 districts in Mato Grosso for deforestation (2013–2023), with breakdown by year. Each horizontal bar represents a district, ordered by total deforestation over the 11-year period. The length of the bar corresponds to total deforestation (ha), and colored segments show the contribution of each year (legend on right, 2013–2023). Colniza, Aripuanã, and Marcelândia (top bars) had the highest totals, each exceeding 100,000 ha of clearing. Colniza in particular shows a pronounced spike in 2022 (brown segment), and Poconé shows a very large spike in 2020 (teal segment). (Data source: TMF Deforestation Year for Mato Grosso).
Compliance Assessment
Soy Compliance Status
When we overlay all the criteria – deforestation cut-off, legal registration, and protected area exclusions – the analysis shows that the overwhelming majority of Mato Grosso’s current soy farmland meets EUDR compliance criteria (see Figure 5). Approximately 97.21% of the assessed soy plot area can be categorized as “compliant.” In practical terms, these compliant plots have not cleared any native vegetation after 2020 and they also did not fail the legal checks (they are properly registered and not farming inside a protected reserve). This finding is encouraging: it suggests most soy exported from Mato Grosso would be considered deforestation-free (post-2020) and legally produced, thereby meeting EUDR’s core requirements.
On the other hand, about 2.79% of the soy area was flagged as “non-compliant” by our assessment. These plots failed one or more of the criteria – typically either they showed evidence of deforestation after the cutoff date, or they were unregistered farms found within a protected forest area (an illegal situation). We examined this non-compliant subset to understand the main risk factors behind it.
Recent Deforestation
A number of the non-compliant plots had detectable forest clearing in the years 2021, 2022, or 2023. In fact, thousands of hectares were cleared across soy farms in those years – with the largest cleared areas being roughly 2,400 ha in 2021, 3,000 ha in 2022, and 2,400 ha in 2023. Any soy planted on land that was deforested in those years violates the EUDR cutoff, rendering those plots non-compliant. These cases likely represent farmers expanding their cultivation into forest areas or clearing portions of their legal reserves after 2020.
Land Legality and Protected Areas
The vast majority of soy-producing land in Mato Grosso appears to be legally compliant with respect to land tenure. Approximately 97.1% of the state’s soy cultivation area is officially registered in SNCI/SIGEF, indicating those farms have proper land title and environmental registration. Only about 2.9% of the soy area remains unregistered or of unclear legal status. We also found a few cases of soy encroachment into protected forests: soy plots overlapping Permanent Forest Reserves (PRFs) were identified in eight districts of Mato Grosso (ICMBio, 2023). These instances represent clear legal infringements, as farming is not allowed in those reserve areas. While the number of overlaps is limited, any soy coming from those plots would be automatically non-compliant due to illegal location. Aside from these isolated cases, however, most soy farms are operating on legally authorized land.
Protected Area Overlaps
We identified 36 soy plots that lie inside designated Permanent Forest Reserves (spread across the eight districts mentioned earlier). Soy from these areas is automatically non-compliant because the land itself is off-limits for agriculture. These instances are relatively rare, but each is a serious breach of land-use law.
Unregistered Farms in Protected Areas
A subset of non-compliant cases may involve plots that are both unregistered and in a protected area. Our criteria were somewhat conservative – if a plot was unregistered but not overlapping a protected area (and had no post-2020 deforestation), we did not immediately mark it as non-compliant. We assumed lack of registration alone (without other red flags) might not violate EUDR if the farm is otherwise legal and deforestation-free, since EUDR doesn’t explicitly mandate formal land titles but rather compliance with local laws. This cautious approach means the 2.79% non-compliant figure is likely a lower-bound estimate. If we had applied stricter rules (for example, considering any unregistered plot as non-compliant), the share of non-compliant soy area could rise to around ~5% of the total. We focused on the most clear-cut violations for this analysis.
Figure 5: EUDR Compliance Status of Soy Plots in Mato Grosso. The map displays the classification of soy cultivation areas based on deforestation and legal status. Green areas represent compliant plots with no post-2020 deforestation and valid land registration. Red areas are non-compliant due to either recent clearing or unclear tenure.
District-Level Risk Assessment
Beyond looking at individual farms, we also evaluated overall compliance risk by district (see Figure 6). Out of Mato Grosso’s 141 districts (municipalities), none were categorized as “High Risk” in aggregate, which is a positive sign. We classified 97 districts as Low Risk and 44 as Medium Risk for EUDR compliance. Even though no district was flagged as high risk, the Medium Risk category highlights where attention is needed. For example, certain districts like Porto Estrela have known cases of soy fields overlapping protected forests (hence some risk), and Colniza has a notable number of unregistered soy plots contributing to risk.
Additionally, major soybean production hubs such as Sorriso might carry traceability risks (mixing of soy from different farms at aggregation points). The Medium Risk areas are those with some red flags – be it recent deforestation, legal registration gaps, or proximity to remaining forests that could tempt future clearing. These areas will require enhanced due diligence and monitoring, even though they are not in outright violation at the moment. By contrast, the Low Risk districts show stable, compliant conditions with no significant deforestation after 2020 and strong legal adherence.
Figure 6: District-Level EUDR Risk Classification in Mato Grosso. The map categorizes the state’s 141 districts based on deforestation, legality, and traceability factors. Districts outlined in green are classified as Low Risk, while those in orange are Medium Risk.
Challenges and Opportunities
Implementing EUDR in the soy supply chain does pose several challenges that stakeholders must navigate:
Traceability: Achieving full farm-to-port traceability for soy is difficult, yet it is crucial under EUDR. Soy supply chains often mix produce from many farms, making it hard to trace each batch back to its origin. Ensuring every shipment’s origin is known and verified as deforestation-free requires overhauling traditional commodity trading systems (WBCSD & Guidehouse, 2024).
Legal Verification: Verifying that all soy is produced legally (in line with Brazilian environmental and land laws) demands rigorous and continuous monitoring of legal permits, environmental licenses, and land titles. Any changes in a farm’s legal status (e.g. a license expiring or a farm expanding into an unregistered area) could affect compliance (ABIOVE & APROSOJA, 2024). Keeping tabs on these aspects for thousands of farms is a significant administrative challenge.
Continuous Monitoring: Even if a farm is compliant today, ongoing surveillance is needed to catch any new deforestation or encroachment that might occur. Regular satellite monitoring and alert systems are critical to detect deforestation in near-real-time and to ensure that no new illegal clearing goes unnoticed (DLA Piper, 2024). In a state as large as Mato Grosso, maintaining this continuous vigilance over millions of hectares is challenging.
On the other hand, EUDR also brings opportunities and benefits that can be leveraged:
Transparency and Market Advantage: Complying with EUDR can push companies to improve supply chain transparency and documentation. In a market that increasingly demands sustainable products, this transparency can become a competitive advantage. Soy exporters who can prove their product is deforestation-free and legal may access premium markets and foster trust with buyers (WBCSD & Guidehouse, 2024).
Technological Innovation: The stringent requirements spur innovation in monitoring and traceability tools. Advanced technologies like satellite imagery, AI-driven deforestation detection, blockchain for supply chain traceability, and big-data platforms are being adopted to improve accuracy and efficiency. These innovations not only help with EUDR compliance but also modernize agricultural supply chain management for the better.
Alignment with Sustainability Goals: By enforcing no-deforestation and legality, EUDR compliance efforts align with broader environmental and sustainability goals. Strengthening land-use governance and protecting forests contribute to climate change mitigation and biodiversity conservation. This alignment enhances Mato Grosso’s reputation as a responsible soy producer committed to sustainable development (Trase, 2020).
Role of Technology in EUDR Compliance
One promising avenue to tackle the above challenges is the deployment of dedicated technological solutions for monitoring and due diligence. For instance, MosaiX’s Agriplot Due-Diligence System (DDS) is a platform designed to help companies seamlessly comply with regulations like EUDR. Such a system provides end-to-end visibility and control over the supply chain by integrating various data streams. Key features of the Agriplot DDS include accurate geolocation of soy farms and real-time tracing of supply chains, automated compliance checks against deforestation alerts and protected area databases, and risk assessment tools that flag high-risk suppliers or regions in the chain. The platform can also generate standardized due-diligence reports to fulfill EUDR reporting requirements with ease.
Notably, systems like Agriplot DDS come with extensive global data coverage. In the case of MosaiX’s platform, it builds on a rich database of soy production worldwide (MosaiX, 2023). In Latin America alone, the system includes data on roughly 51.1 million hectares of soy fields and tracks operations of over 100 soy-related facilities across Brazil, Argentina, Bolivia, and Paraguay. Additionally, it includes data on about 1.6 million hectares of soy plantations in Canada. This breadth of data enables cross-border analysis and benchmarking, which is valuable as traders source soy from multiple countries. A dedicated due diligence platform, hosted on secure servers, allows businesses to customize and privately manage their supply chain data. By leveraging such advanced tools, soy exporters and buyers can more efficiently achieve EUDR compliance, manage their deforestation and legality risks, and promote sustainability across their operations. In short, technology is acting as an enabler – turning a daunting compliance exercise into a more streamlined, data-driven process.
Summary of Findings
Our assessment of Mato Grosso’s soy supply chain reveals an overall positive outlook for EUDR compliance. Over 97.21% of the state’s soy-producing area already meets the EUDR criteria, meaning the vast majority of farms are deforestation-free (post-2020) and in adherence with Brazil’s legal requirements. This high rate of compliance indicates that most soy exporters in Mato Grosso are well-positioned to fulfill their due diligence obligations. Only a very small fraction of production – about 2.79% of the area – is flagged as potentially non-compliant or “at-risk” under the EUDR.
These non-compliant cases are concentrated in a few localized areas and are not representative of the state as a whole. The primary risk factors identified include post-2020 deforestation on certain farms, overlaps of soy fields with protected forests, and a handful of farms lacking proper registration. Importantly, no major region or municipality in Mato Grosso was categorized as “High Risk” for EUDR; the compliance issues tend to be isolated exceptions rather than widespread problems.
Overall, our findings highlight that EUDR-aligned production is already the norm in Mato Grosso’s soy sector. The small number of non-compliant cases can be addressed through targeted interventions, bringing the entire state’s production up to the required standard.
Conclusion
Mato Grosso’s soy supply chain appears largely prepared to meet the EU’s deforestation-free and legality standards. With well over 97.21% of soy area in compliance, the state stands as a strong example of how large- scale agriculture can align with strict environmental regulations. Addressing the remaining few percent of at-risk areas will be critical to achieve full compliance and maintain market access to the EU. Targeted actions should focus on the handful of problem cases identified – for instance, enforcing protections in zones where soy still encroaches on public forests, and accelerating land regularization for the few farms on unregistered properties. Strengthening on-the-ground enforcement (aided by enhanced alert verification systems like Inovasi Digital’s) and supporting farmers in rectifying any legal irregularities will help close the gaps.
By taking these steps, Mato Grosso can safeguard its vital EU export market and also solidify its reputation as a sustainable, deforestation-free soy producer. The case of Mato Grosso demonstrates that with robust data-driven monitoring and decisive enforcement, even a major agricultural frontier can achieve a high level of compliance with global anti-deforestation standards. This marriage of productivity with environmental compliance serves as an encouraging model for other regions. Moving forward, continued vigilance and innovation will ensure that Mato Grosso not only remains compliant with EUDR but also contributes positively to global sustainability goals.
Disclaimer: This article is intended for research and informational purposes only. It is not intended to serve as a legal basis for EUDR submissions or regulatory compliance.
References
ABIOVE & APROSOJA. (2024).Impact of EUDR on Brazilian soy exports. FeedNavigator. Retrieved from https://www.feednavigator.com
Council of the European Union. (2024). EU deforestation law: Council extends application timeline. Retrieved from https://www.consilium.europa.eu
DLA Piper. (2024). EU Deforestation Regulation implications. Retrieved from https://www.dlapiper.com
ICMBio. (2023). National System of Conservation Units (SNUC). Retrieved from https:// www.icmbio.gov.br
Köhl, M., Bourgoin, C., et al. (2023). JRC Global Forest Cover and Deforestation Dataset. European Commission, Joint Research Centre.
MosaiX. (2023). Agriplot Due-Diligence System Features. Retrieved from https://mosaix.earth/solution/
Reuters. (2023). Brazil soy output and trade statistics. Retrieved from https://www.reuters.com
Reuters. (2024). Brazil Supreme Court suspends Mato Grosso deforestation law. Retrieved from https:// www.reuters.com
Trase. (2020). Soy and Deforestation Dynamics in Brazil. Retrieved from https://trase.earth
WBCSD & Guidehouse. (2024). Understanding the EU Deforestation Regulation. Retrieved from https://www.wbcsd.org
The implementation of the EU Deforestation-Free Regulation (EUDR) is fast approaching, requiring operators and traders who wish to market their goods in the European Union to understand and prepare for its requirements. ADM, as one of Inovasi Digital’s partners, markets products to the European market. Therefore, ADM and its suppliers need to comprehend the EUDR requirements. This necessity led to Inovasi Digital’s training for ADM’s suppliers, where EUDR and Inovasi Agriplot, a solution for EUDR compliance, were introduced.
On May 8, 2024, Inovasi Digital held a meeting with ADM suppliers titled “Assisting Supplier Readiness for EUDR Implementation with Inovasi Agriplot Due Diligence System” in Medan, Indonesia. During this event, Inovasi Digital provided suppliers with an introduction to EUDR, outlined the requirements for EUDR compliance, and explained Inovasi Agriplot, a turnkey solution for EUDR assessment and compliance. The objective was to support ADM’s suppliers in preparing for EUDR compliance later this year.
In this meeting, suppliers—including growers, mills, and palm oil dealers—received a presentation on EUDR, covering the history of the regulation, key requirements, and challenges. The goal was to help suppliers understand the real challenges ahead and prepare to meet the requirements. Next, the audience was introduced to the Inovasi Agriplot Due Diligence System, a solution created by Inovasi Digital to address all EUDR requirements for both operators and traders. By introducing the Inovasi Agriplot DDS, ADM suppliers can learn how to ensure a smooth transition to using the system.
The Inovasi Agriplot Due Diligence System is a comprehensive solution for those seeking to market their goods to the EU. It covers all aspects required by the EUDR in a single product. Currently, the Inovasi Agriplot Due Diligence System fully supports palm oil and is expanding to other commodities covered by the EUDR.
With the Inovasi Agriplot Due Diligence System, you will receive:
Traceability through Map and Supplier Information Requirements
Forest Cover and Deforestation Compliance Assessment
Legal Compliance Assessment to National Laws
Risk Assessment at the District Level for Land Plots
Risk Mitigation Plan Development and Advice
Positioned with a unique combination of spatial data, big data processing, and on-the-ground knowledge, Inovasi Agriplot is the most accurate and trustworthy platform for meeting all operators’ EUDR needs, from tracing their supply base to completing DDS requirements to risk assessments and effective mitigation approaches.
The EU Deforestation Regulation (EUDR) has been a prominent issue facing many operators across several key commodities who seek to trade them into and out of the European Union (EU). Palm oil is one such commodity, and the EUDR aims to stop deforestation-related commodities from entering supply chains linked to operators in the EU.
On 20th November 2023, Inovasi Digital and MosaiX held an event titled “Navigating EUDR Requirements: Solutions for Effective Implementation” at Black Pond Tavern, in Jakarta. It was hosted by Inovasi Digital and attracted over 60 participants from various companies and organizations concerned with addressing the challenges associated with EUDR implementation.
The event included presentations by Eddy Esselink from the Netherlands Oils and Fats Organization (MVO), who shared the views and concerns of operators, as well as Andrew Ng from MosaiX BV, and Ihwan Rafina from PT Inovasi Digital, who identified and explained the critical EUDR requirements through their presentation titled “EUDR Un-Redacted”. A discussion on the topic followed, which was moderated by Sara Wayne.
The moderator began the session by framing the core requirements of the EUDR for the audience. That included revisiting the evolution of the EU laws and initiatives that led to the adoption of the EUDR. Then she briefly touched upon the demands of the EUDR itself and identified the deforestation as well as legality components
The event was divided into two sessions, the first session included presentations and discussions on the challenges posed by the EUDR and the solutions developed by Inovasi Digital and MosaiX, and the second session was a cocktail event designed to facilitate the building and expansion of professional networks in a relaxed and informal setting. During the first session, the speakers delved into the current state of the palm oil sector, the challenges arising from the newly enforced EU regulation, and the solution developed by MosaiX called Inovasi Agriplot.
Eddy Esselink, Senior Program Manager of Sustainable Development of MVO
Eddy Esselink started the session by explaining that there were many unanswered questions, indicating several aspects of the regulations that remained unclear. He proposed for harmonization in the implementation of the EUDR across jurisdictions. Two specific aspects were highlighted: the need for clarity on the required documents related to legal compliance and the importance of harmonizing information for risk assessments. Eddy called for efforts to engage with governments through a coordinated response.
Andrew Ng, Sustainability Project Manager of Mosaix
The second speaker was Andrew Ng from MosaiX. Andrew covered the various requirements and potential approaches to address the EUDR. The presentation touched on the complexities of gathering verifiable and detailed information. Several approaches were then proposed with an emphasis on the critical need for reliable data sources.
Ihwan Rafina, Technical Director of Inovasi Digital
The last presenter was Ihwan Rafina from Inovasi Digital who expanded on how to address the challenges with an approach used by ID’s InovasiAgriplot system. Ihwan expanded on the types of approaches to determining mapping requirements, deforestation assessments, legal compliance, and closing of traceability gaps. Challenges due to weak points for information gathering include the supplier mills’ information, accessing legal documents, inconsistencies between official and physical data, and other technical complexities explained. Broader issues like different international and national forest definitions were discussed as well.
Ihwan compared certification information disclosure (like RSPO / MSPO) to EUDR requirements and highlighted that potential shortfalls existed that meant considering certification as compliant to EUDR cannot be assumed. Then the presentation showcased the extensive data collected by Inovasi Digital and Mosaix, which would be critical for mapping, traceability, legality, and risk assessments. The extensive data collected across different EUDR-required criteria ensures InovasiAgriplot system would identify compliant supply chains with greater accuracy. The expertise in combining Big-Data, analytics with on-the-ground experience was highlighted as the system’s main risk assessment strength.
The session was followed by a networking event where the conversation continued amongst various operators along the supply chain.
Want to know more about what we think about EUDR? Discover our solution here.